

Question: An article in Talanta (2005, Vol. 65, pp. 895899) presented a 2 3 factorial design to find lead level by using flame atomic absorption spectrometry
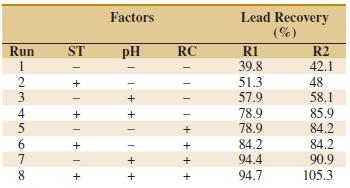
An article in Talanta (2005, Vol. 65, pp. 895€“899) presented a 23factorial design to find lead level by using flame atomic absorption spectrometry (FAAS). The data are in the following table.
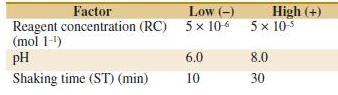
The factors and levels are in the following table.
(a) Construct a normal probability plot of the effect estimates. Which effects appear to be large?
(b) Conduct an analysis of variance to confirm your findings for part (a).
(c) Analyze the residuals from this experiment. Are there any problems with model adequacy?
Lead Recovery (%) Factors Run ST pH RC R1 39.8 51.3 57.9 R2 42.1 48 58.1 85.9 84.2 78.9 78.9 84.2 94.4 84.2 90.9 94.7 105.3 I|I + + + + II + +I I + + EI +I +I + + -234 5678
Step by Step Solution
3.38 Rating (173 Votes )
There are 3 Steps involved in it
a The plot below shows standardized effects A standardized effect equals the effect divided by its s... View full answer

Get step-by-step solutions from verified subject matter experts