

Question: An automatic sensor measures the diameter of holes in consecutive order. The results of measuring 25 holes are in the following table. (a) Using all
An automatic sensor measures the diameter of holes in consecutive order. The results of measuring 25 holes are in the following table.
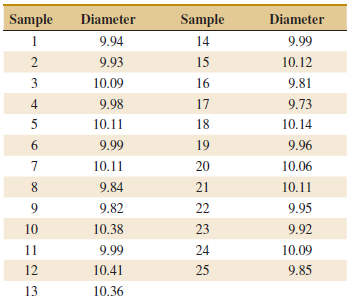
(a) Using all the data, compute trial control limits for individual observations and moving-range charts. Construct the control chart and plot the data. Determine whether the process is in statistical control. If not, assume that assignable causes can be found to eliminate these samples and
revise the control limits.
(b) Estimate the process mean and standard deviation for the in-control process.
Sample Diameter Sample Diameter 1 9.94 14 9.99 2 9.93 15 10.12 10.09 16 9.81 4 9.98 17 9.73 5 10.11 18 10.14 6. 9.99 19 9.96 10.11 20 10.06 10.11 8. 9.84 21 9. 9.82 22 9.95 10 10.38 23 9.92 11 9.99 24 10.09 9.85 12 10.41 25 10.36 13
Step by Step Solution
3.43 Rating (169 Votes )
There are 3 Steps involved in it
a b Estimated process mean and standard deviation Indx UCL Centerline LCL out of ... View full answer

Get step-by-step solutions from verified subject matter experts