

Question: Consider the diameter data in Exercise 15-75. Assume that the desired process target is 10.0 millimeters. (a) Estimate the process standard deviation. (b) Construct an
(a) Estimate the process standard deviation.
(b) Construct an EWMA control chart with λ = 0.2. Does the process appear to be in control?
(c) Construct an EWMA control chart with λ = 0.5. Compare your results to part (a).
Exercise 15-75
An automatic senson measures the diameter of holes in consecutive order. The results of measuring 25 holes follow.
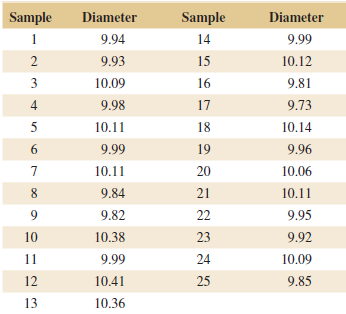
Sample Diameter Sample Diameter 1 9.94 14 9.99 9.93 15 10.12 3 10.09 16 9.81 9.98 9.73 17 5 10.11 18 10.14 6. 9.99 19 9.96 10.11 20 10.06 8. 9.84 21 10.11 9. 9.82 22 9.95 10 10.38 23 9.92 11 9.99 24 10.09 12 10.41 25 9.85 13 10.36
Step by Step Solution
3.35 Rating (158 Votes )
There are 3 Steps involved in it
a Estimated standard deviation from the moving range ... View full answer

Get step-by-step solutions from verified subject matter experts