

Question: Consider the gas mileage data in Exercise 12-11. Build regression models for the data from the numerical regressors using the following techniques: (a) All possible
Consider the gas mileage data in Exercise 12-11. Build regression models for the data from the numerical regressors using the following techniques:
(a) All possible regressions.
(b) Stepwise regression.
(c) Forward selection.
(d) Backward elimination.
(e) Comment on the models obtained. Which model would you prefer? Why?
(f) Now construct indicator variable for trns and drv and add these to the list of regressors. Repeat the model building in the previous parts. Does your conclusion in part (e) change?
Exercise 12-11
Table E12-3 provides the highway gasoline mileage test results for 2005 model year vehicles from DaimlerChrysler. The full table of data (available on the book€™s Web site) contains the same data for 2005 models from over 250 vehicles from many manufacturers (Environmental Protection Agency Web site www.epa.gov/ otaq/cert/mpg/testcars/database).
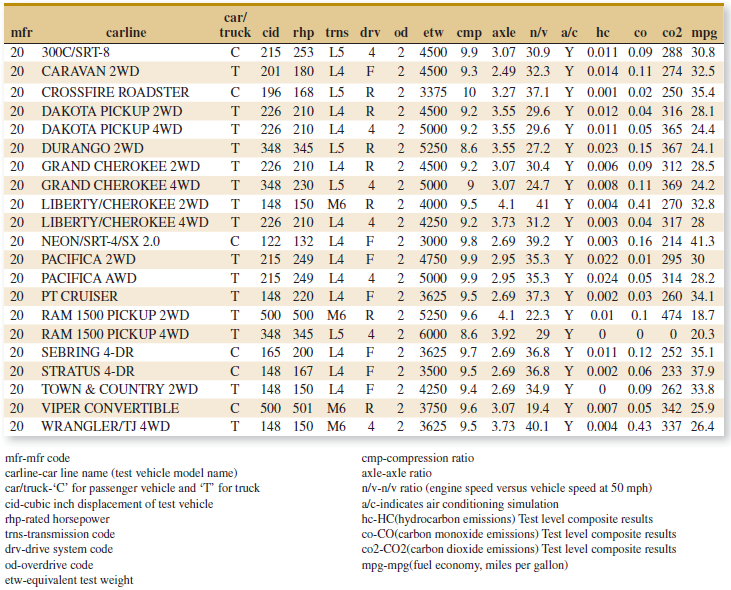
car/ truck cid rhp trns drv od co2 mpg mfr carline he etw cmp axle n/v a/c co 20 300C/SRT-8 C 215 253 L5 2 4500 9.9 3.07 30.9 Y 0.011 0.09 288 30.8 20 CARAVAN 2WD T 201 180 LA 2 4500 9.3 2.49 32.3 Y 0.014 0.11 274 32.5 20 CROSSFIRE ROADSTER 196 168 L5 R. 2 3375 10 3.27 37.1 Y 0.001 0.02 250 35.4 20 DAKOTA PICKUP 2WD 226 210 L4 R. 2 4500 9.2 3.55 29.6 Y 0.012 0.04 316 28.1 20 DAKOTA PICKUP 4WD 226 210 L4 4 2 5000 9.2 3.55 29.6 Y 0.011 0.05 365 24.4 348 345 L5 20 DURANGO 2WD R. 2 5250 8.6 3.55 27.2 Y 0.023 0.15 367 24.1 20 GRAND CHEROKEE 2WD 226 210 L4 R. 2 4500 9.2 3.07 30.4 Y 0.006 0.09 312 28.5 20 GRAND CHEROKEE 4WD 348 230 L5 4. 2 5000 9 3.07 24.7 Y 0.008 0.11 369 24.2 148 150 M6 4.1 20 LIBERTY/CHEROKEE 2WD 2 4000 9.5 41 Y 0.004 0.41 270 32.8 20 LIBERTY/CHEROKEE 4WD 226 210 L4 2 4250 9.2 3.73 31.2 Y 0.003 0.04 317 28 20 NEON/SRT-4/SX 2.0 122 132 L4 2 3000 9.8 2.69 39.2 Y 0.003 0.16 214 41.3 20 PACIFICA 2WD T 215 249 L4 2 4750 9.9 2.95 35.3 Y 0.022 0.01 295 30 20 PACIFICA AWD 215 249 LA 4 2 5000 9.9 2.95 35.3 Y 0.024 0.05 314 28.2 20 PT CRUISER 148 220 L4 2 3625 9.5 2.69 37.3 Y 0.002 0.03 260 34.1 0.1 474 18.7 0 20.3 20 RAM 1500 PICKUP 2WD 500 500 M6 R. 2 5250 9.6 4.1 22.3 Y 0.01 20 RAM 1500 PICKUP 4WD 348 345 L5 4 6000 8.6 3.92 29 Y 20 SEBRING 4-DR 165 200 L4 2 3625 9.7 2.69 36.8 Y 0.011 0.12 252 35.1 20 STRATUS 4-DR 148 167 LA 2 3500 9.5 2.69 36.8 Y 0.002 0.06 233 37.9 20 TOWN & COUNTRY 2WD 148 150 L4 2 4250 9.4 2.69 34.9 Y 0.09 262 33.8 20 VIPER CONVERTIBLE 500 501 M6 R. 2 3750 9.6 3.07 19.4 Y 0.007 0.05 342 25.9 20 WRANGLER/TJ 4WD 148 150 M6 4 2 3625 9.5 3.73 40.1 Y 0.004 0.43 337 26.4 cmp-compression ratio axle-axle ratio mfr-mfr code carline-car line name (test vehicle model name) car/truck-"C" for passenger vehicle and "T" for truck cid-cubic inch displacement of test vehicle rhp-rated horsepower tms-transmission code drv-drive system code od-overdrive code n/v-n/v ratio (engine speed versus vehicle speed at 50 mph) alc-indicates air conditioning simulation he-HC(hydrocarbon emissions) Test level composite results co-CO(carbon monoxide emissions) Test level composite results co2-CO2(carbon dioxide emissions) Test level composite results mpg-mpg(fuel economy, miles per gallon) etw-equivalent test weight
Step by Step Solution
3.29 Rating (155 Votes )
There are 3 Steps involved in it
This analysis includes the emissions variables hc co and co2 It would be reasonable to consider mode... View full answer

Get step-by-step solutions from verified subject matter experts