

Question: Consider the gray range modulation data in Exercise 12-19. Use the useful range as the response. Build regression models for the data using the following
(a) All possible regressions.
(b) Stepwise regression.
(c) Forward selection.
(d) Backward elimination.
(e) Comment on the models obtained. Which model would you prefer? Why?
Exercise 12-19
An article in Optical Engineering [€œOperating Curve Extraction of a Correlator€™s Filter€ (2004, Vol. 43, pp. 2775€“2779)] reported on the use of an optical correlator to perform an experiment by varying brightness and contrast. The resulting modulation is characterized by the useful range of gray levels.
The data follow:
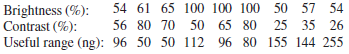
Brightness (%): Contrast (%): Useful range (ng): 96 54 61 65 100 100 100 50 57 54 56 80 70 50 65 80 25 35 26 50 50 112 96 80 155 144 255
Step by Step Solution
3.58 Rating (169 Votes )
There are 3 Steps involved in it
a The min C p model is x 2 The min model is the sa... View full answer

Get step-by-step solutions from verified subject matter experts