

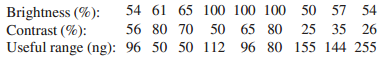
Question: Consider the regression model fit to the gray range modulation data in Exercise 12-19. Use the useful range as the response. (a) What proportion of
(a) What proportion of total variability is explained by this model?
(b) Construct a normal probability plot of the residuals. What conclusion can you draw from this plot?
(c) Plot the residuals versus y and versus each regressor, and comment on model adequacy.
(d) Calculate Cook€™s distance for the observations in this data set. Are there any influential points in these data?
Brightness (%): Contrast (%): Useful range (ng): 96 50 50 112 54 61 65 100 100 100 50 57 54 50 65 80 96 80 155 25 35 26 56 80 70 144 255
Step by Step Solution
3.40 Rating (162 Votes )
There are 3 Steps involved in it
a R 2 756 b Assumption of normality appears adequate c Assumption of constant ... View full answer

Get step-by-step solutions from verified subject matter experts