

Question: Consider the U chart for printed circuit boards in Example 15-5. The center line = 1.6, UCL = 3.3, and n = 5. (a) Calculate
Consider the U chart for printed circuit boards in Example 15-5. The center line = 1.6, UCL = 3.3, and n = 5.
(a) Calculate the LCL and UCL.
(b) Suppose that the true mean defects per unit shifts from 1.6 to 2.4. What is the ARL after the shift? Assume that the average defects per unit are approximately normally distributed.
(c) Rework part (b) if the true mean defects per unit shifts from 1.6 to 2.0 and comment on the difference in ARL.
Example 15-5
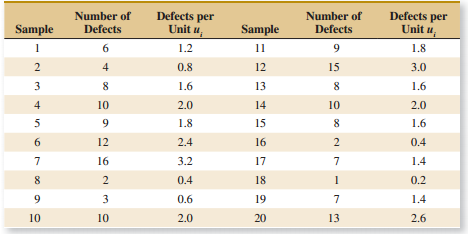
Printed circuit boards are assembled by a combination of manual assembly and automation. Surface mount technology (SMT) is used to make the mechanical and electrical connections of the components to the board. Every hour, five boards are selected and inspected for process-control purposes. The number of defects in each sample of five boards is noted. Results for 20 samples are shown in Table 15-6.
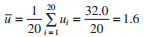
 The center line for the Uchart is
and the upper and lower control limits are
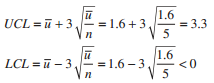
The control chart is plotted in Fig. 15-17. Because LCLis negative, it is set to 0. From the control chart in Fig. 15-17, we see that the process is in control.
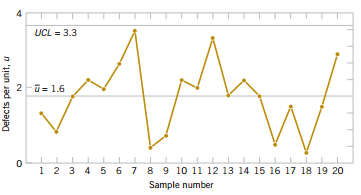
Practical Interpretation: Eight defects per group of five circuit boards are too many (about 8 / 5 = 1.6 defects/board), and the process needs improvement. An investigation of the specific types of defects found on the printed circuit board needs to be made. This usually suggests potential avenues for process improvement.
Defects per Unit u, Defects per Number of Number of Unit u Sample Defects Sample Defects 1.2 11 9. 1.8 12 4 0.8 15 3.0 1.6 13 1.6 10 2.0 14 10 2.0 15 9. 1.8 1.6 6. 12 2.4 16 2 0.4 16 3.2 17 1.4 1.4 0.4 18 0.2 3 0.6 19 1.4 10 10 2.0 20 13 2.6 2. 32.0 =1.6 20 20
Step by Step Solution
3.35 Rating (170 Votes )
There are 3 Steps involved in it
a b The standard deviation of U is when the mean of U i... View full answer

Get step-by-step solutions from verified subject matter experts