

Question: Please Solve this Problem Using Excel Only, the Excel example is the second image. S6.2 The overall average on a process you are attempting to
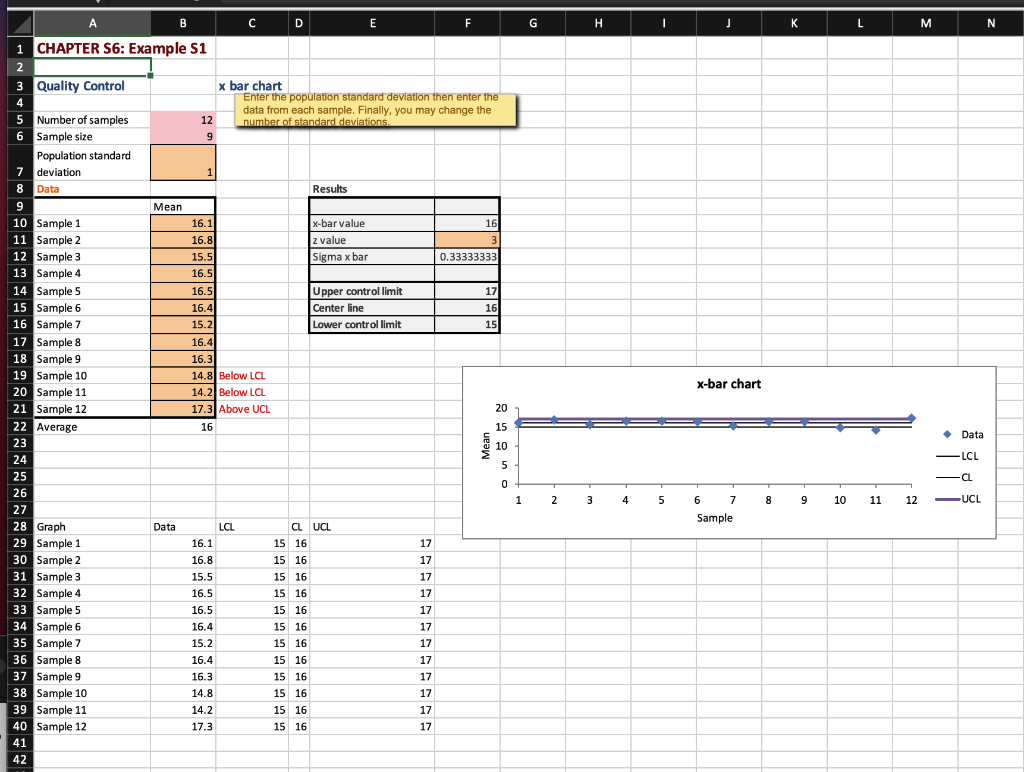
Please Solve this Problem Using Excel Only, the Excel example is the second image.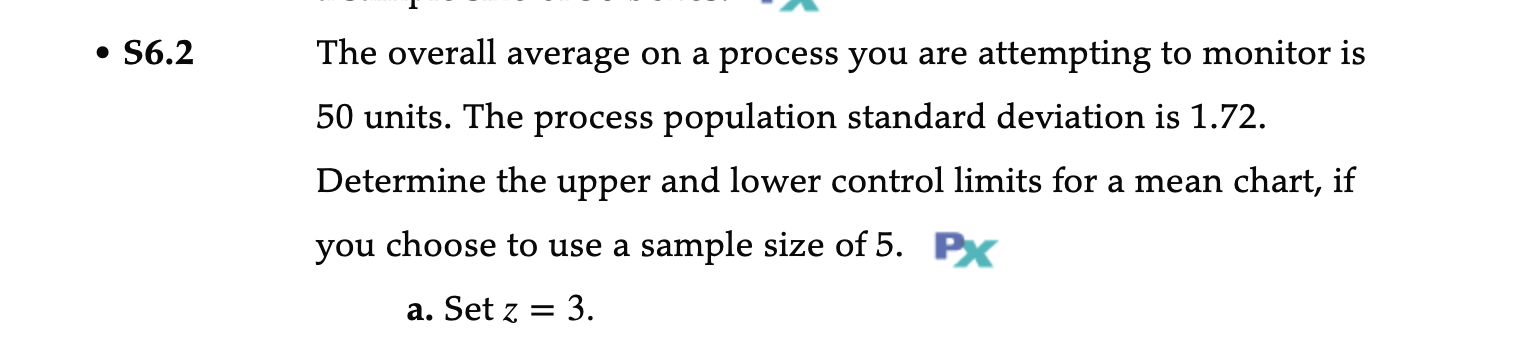
Step by Step Solution
There are 3 Steps involved in it
1 Expert Approved Answer
Step: 1 Unlock

Question Has Been Solved by an Expert!
Get step-by-step solutions from verified subject matter experts
Step: 2 Unlock
Step: 3 Unlock