

Question: Consider the X control chart in Fig. 15-3. Suppose that the mean shifts to 74.010 millimeters. (a) What is the probability that this shift is
(a) What is the probability that this shift is detected on the next sample?
(b) What is the ARL after the shift?
Fig. 15-13
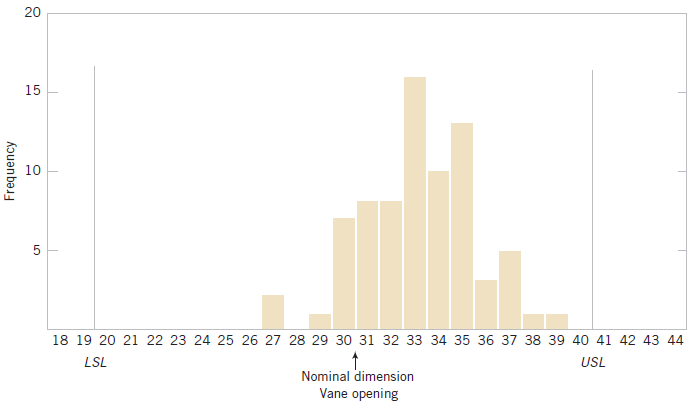
15 10 5 18 19 20 21 22 23 24 25 26 27 28 29 30 31 32 33 34 35 36 37 38 39 40 41 42 43 44 LSL USL Nominal dimension Vane opening Frequency 20
Step by Step Solution
★★★★★
3.41 Rating (160 Votes )
There are 3 Steps involved in it
1 Expert Approved Answer
Step: 1 Unlock

a The probability that this shift ... View full answer
Question Has Been Solved by an Expert!
Get step-by-step solutions from verified subject matter experts
Step: 2 Unlock
Step: 3 Unlock