

Question: Construct a normal probability plot of the suspended solids concentration data in Exercise 6-40. Does it seem reasonable to assume that the concentration of suspended
Data from 6-40
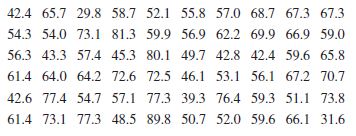
42.4 65.7 29.8 58.7 52.1 55.8 57.0 68.7 67.3 67.3 59.9 54.3 54.0 73.1 81.3 56.3 43.3 57.4 45.3 80.1 49.7 42.8 42.4 59.6 65.8 56.9 62.2 69.9 66.9 59.0 61.4 64.0 64.2 72.6 72.5 46.1 53.1 56.1 67.2 70.7 42.6 77.4 54.7 57.1 77.3 39.3 76.4 59.3 51.1 73.8 61.4 73.1 77.3 48.5 89.8 50.7 52.0 59.6 66.1 31.6
Step by Step Solution
★★★★★
3.47 Rating (160 Votes )
There are 3 Steps involved in it
1 Expert Approved Answer
Step: 1 Unlock

The data appear to be normally distributed Nearly all of ... View full answer
Question Has Been Solved by an Expert!
Get step-by-step solutions from verified subject matter experts
Step: 2 Unlock
Step: 3 Unlock