

Question: Construct a normal probability plot of the cycles to failure data in Exercise 6-31. Does it seem reasonable to assume that cycles to failure is
Data from 6-31
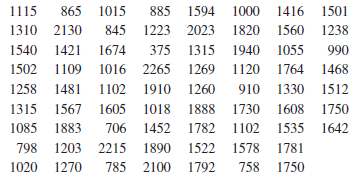
1115 865 1015 885 1594 1000 1416 1501 1310 2130 845 1223 2023 1820 1560 1238 1540 1421 1674 375 1315 1940 1055 990 1502 1109 1016 2265 1269 1120 1764 1468 1258 1481 1102 1910 1260 910 1330 1512 1315 1567 1605 1018 1888 1730 1608 1750 1085 1883 706 1452 1782 1102 1535 1642 798 1203 2215 1890 1522 1578 1781 785 2100 1792 1750 1020 1270 758
Step by Step Solution
★★★★★
3.39 Rating (161 Votes )
There are 3 Steps involved in it
1 Expert Approved Answer
Step: 1 Unlock

The data appear to be approximately normally distributed Howe... View full answer
Question Has Been Solved by an Expert!
Get step-by-step solutions from verified subject matter experts
Step: 2 Unlock
Step: 3 Unlock