

Question: Construct frequency distributions and histograms with 8 bins and 16 bins for the motor fuel octane data in Exercise 6-30. Compare the histograms. Do both
Data from 6-30
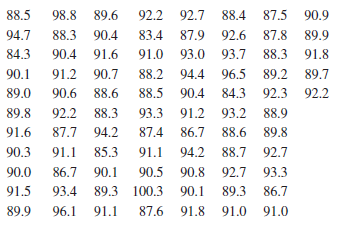
88.5 98.8 89.6 92.2 92.7 88.4 87.5 90.9 94.7 88.3 90.4 83.4 87.9 92.6 87.8 89.9 84.3 90.4 91.6 91.0 93.0 93.7 88.3 91.8 90.1 91.2 90.7 88.2 94.4 96.5 89.2 89.7 84.3 92.3 89.0 90.6 88.6 88.5 90.4 92.2 89.8 92.2 88.3 93.3 91.2 93.2 88.9 88.6 89.8 91.6 87.7 94.2 87.4 86.7 90.3 91.1 85.3 91.1 94.2 88.7 92.7 86.7 90.1 90.0 90.5 90.8 92.7 93.3 90.1 89.3 91.5 93.4 89.3 100.3 86.7 89.9 96.1 91.1 87.6 91.8 91.0 91.0
Step by Step Solution
3.41 Rating (164 Votes )
There are 3 Steps involved in it
Solutions uses the n 83 observations from the data set Frequency Tabulation for Exercise 622Octane D... View full answer

Get step-by-step solutions from verified subject matter experts