

Question: Construct a frequency distribution and histogram for the yield data in Exercise 6-33. Data from 6-33 94.1 86.1 95.3 84.9 88.8 84.6 94.4 84.1 78.3
Data from 6-33
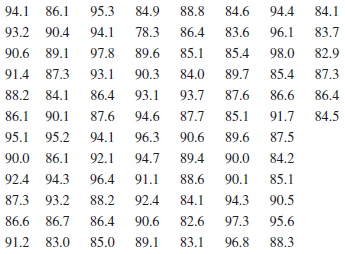
94.1 86.1 95.3 84.9 88.8 84.6 94.4 84.1 78.3 93.2 90.4 94.1 86.4 83.6 96.1 83.7 89.6 98.0 90.6 89.1 97.8 85.1 85.4 82.9 91.4 87,3 89.7 87.3 93.1 90.3 84.0 85.4 87.6 88.2 84.1 86.4 93.1 93.7 86.6 86.4 86.1 90.1 94.6 87.6 87.7 85.1 91.7 84.5 95.1 95.2 94.1 96.3 90.6 89.6 87.5 90.0 86.1 92.1 94.7 89.4 90.0 84.2 96.4 92.4 94.3 91.1 88.6 90.1 85.1 87.3 93.2 88.2 92.4 84.1 94.3 90.5 86.6 86.7 86.4 90.6 82.6 97.3 95.6 83.1 91.2 83.0 85.0 89.1 96.8 88.3
Step by Step Solution
3.48 Rating (158 Votes )
There are 3 Steps involved in it
Frequency Tabulation for Exercise 625Yield Class at or below 1 2 ... View full answer

Get step-by-step solutions from verified subject matter experts