

Question: In their book Empirical Model Building and Response Surfaces (John Wiley, 1987), Box and Draper described an experiment with three factors. The data in the
In their book Empirical Model Building and Response Surfaces (John Wiley, 1987), Box and Draper described an experiment with three factors. The data in the following table are a variation of the original experiment from their book. Suppose that these data were collected in a semiconductor manufacturing process.
(a) The response y1 is the average of three readings on resistivity for a single wafer. Fit a quadratic model to this response.
(b) The response y2 is the standard deviation of the three resistivity measurements. Fit a linear model to this response.
(c) Where would you recommend that we set x1, x2, and x3 if the objective is to hold mean resistivity at 500 and minimize the standard deviation?
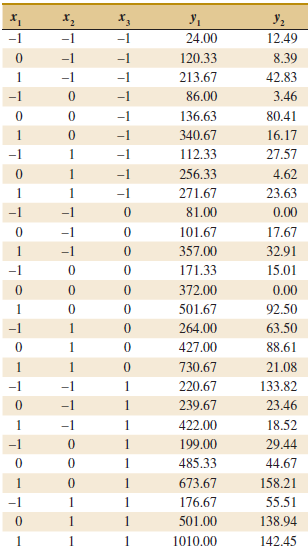
-1 24.00 12.49 -1 120.33 8.39 -1 213.67 42.83 -1 86.00 3.46 136.63 80.41 -1 1 340.67 16.17 -1 1 112.33 27.57 1 -1 256.33 4.62 -1 271.67 23.63 0.00 81.00 -1 101.67 17.67 -1 357.00 32.91 -1 171.33 15.01 372.00 0.00 501.67 92.50 -1 264.00 63.50 427.00 88.61 1 730.67 21.08 1 220.67 133.82 239.67 1 23.46 1. -1 1 422.00 18.52 199.00 -1 29.44 1 485.33 44.67 158.21 1 673.67 -1 1 1 176.67 55.51 1 1 501.00 138.94 1 1 1010.00 142.45
Step by Step Solution
3.42 Rating (155 Votes )
There are 3 Steps involved in it
a Response Surface Regression Estimated Regression Coefficients for y Analysis of Variance for y The ... View full answer

Get step-by-step solutions from verified subject matter experts