

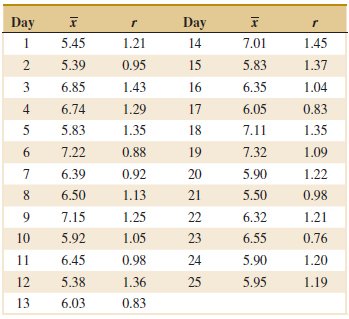
Question: The copper content of a plating bath is measured three times per day, and the results are reported in ppm. The xÌ and r values
(a) Using all the data, find trial control limits for XÌ… and R charts, construct the chart, and plot the data. Is the process in statistical control?
(b) If necessary, revise the control limits computed in part (a), assuming that any samples that plot outside the control limits can be eliminated.
Day Day 1.21 1 5.45 14 7.01 1.45 0.95 1.37 5.39 15 5.83 3 6.85 1.43 16 6.35 1.04 6.74 1.29 17 6.05 0.83 5 5.83 1.35 18 7.11 1.35 7.22 1.09 0.88 19 7.32 6.39 0.92 20 5.90 1.22 8. 6.50 1.13 21 5.50 0.98 1.25 22 9. 7.15 6.32 1.21 6.55 0.76 10 5.92 1.05 23 11 6.45 0.98 24 5.90 1.20 5.95 1.19 12 5.38 1.36 25 13 6.03 0.83
Step by Step Solution
3.35 Rating (167 Votes )
There are 3 Steps involved in it
a There are no points beyond the control limits The process appears to be in control b No ... View full answer

Get step-by-step solutions from verified subject matter experts