

Question: The following data are the number of spelling errors detected for every 1000 words on a news Web site over 20 weeks. (a) What control
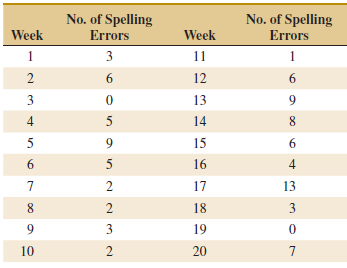
(a) What control chart is most appropriate for these data?
(b) Using all the data, compute trial control limits for the chart in part (a), construct the chart, and plot the data.
(c) Determine whether the process is in statistical control. If not, assume that assignable causes can be found and out-of-control points eliminated. Revise the control limits.
No. of Spelling Errors No. of Spelling Errors Week Week 1 11 1 2 12 3 13 4 14 8. 9. 15 6. 16 2 17 13 8. 18 3 3 19 10 20
Step by Step Solution
3.40 Rating (172 Votes )
There are 3 Steps involved in it
a The U chart is appropriate for these data b The U chart follows c ... View full answer

Get step-by-step solutions from verified subject matter experts