

Question: A article of Epilepsy Research [Statistical Process Control (SPC): A Simple Objective Method for Monitoring Seizure Frequency and Evaluating Effectiveness of Drug Interventions in Refractory
(a) What type of control chart is appropriate for these data? Construct this chart.
(b) Comment on the control of the process.
(c) If necessary, assume that assignable causes can be found, eliminate suspect points, and revise the control limits.
(d) In the publication, the weekly SFs were approximated as normally distributed and an individuals chart was constructed. Construct this chart and compare it to the attribute chart you built in part (a).
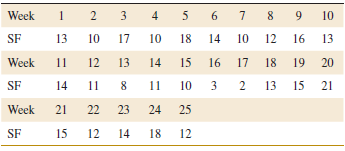
Week 3 4 5 10 SF 13 10 17 10 18 14 10 12 16 13 Week 12 11 13 14 15 16 17 18 19 20 SF 14 11 11 10 3 13 15 21 Week 21 22 23 24 25 SF 15 12 14 18 12 2.
Step by Step Solution
3.53 Rating (170 Votes )
There are 3 Steps involved in it
a A Cchart is appropriate for these data b The process is in control c No signal is reporte... View full answer

Get step-by-step solutions from verified subject matter experts