

The following table shows an example of gross domestic product values for five countries over six years
Question:
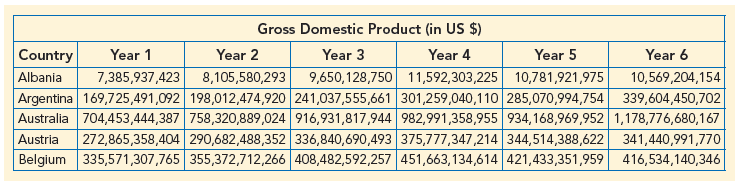
a. How could you improve the readability of this table?
b. The file GDPyears contains sample data from the United Nations Statistics Division on 30 countries and their GDP values from Year 1 to Year 6 in US$. Create a table that provides all these data for a user. Format the table to make it as easy to read as possible.
Fantastic news! We've Found the answer you've been seeking!
Step by Step Answer:
a The readability of the table could be improved by removing unnecessary gridlines leftaligning the ...View the full answer

Answered By
GERALD KAMAU
non-plagiarism work, timely work and A++ work
6+ Reviews
11+ Question Solved
Related Book For 

Essentials Of Business Analytics
ISBN: 9781337406420
3rd Edition
Authors: Jeffrey D. Camm, James J. Cochran, Michael J. Fry, Jeffrey W. Ohlmann, David R. Anderson, Dennis J. Sweeney, Thomas A. Williams
Question Posted:
