

The following table shows the number of e-mails a student received each hour from 8:00 a.m. to
Question:
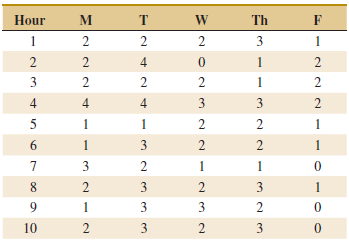
(a) Use the rational subgrouping principle to comment on why an XÌ… chart that plots one point each hour with a subgroup of size 5 is not appropriate.
(b) Construct an appropriate attribute control chart. Use all the data to find trial control limits, construct the chart, and plot the data.
(c) Use the trial control limits from part (b) to identify out-of-control points. If necessary, revise your control limits, assuming that any samples that plot outside the control limits can be eliminated.
Fantastic news! We've Found the answer you've been seeking!
Step by Step Answer:
a Differences between days of the week would change the variation in a subgroup There...View the full answer

Answered By
Utsab mitra
I have the expertise to deliver these subjects to college and higher-level students. The services would involve only solving assignments, homework help, and others.
I have experience in delivering these subjects for the last 6 years on a freelancing basis in different companies around the globe. I am CMA certified and CGMA UK. I have professional experience of 18 years in the industry involved in the manufacturing company and IT implementation experience of over 12 years.
I have delivered this help to students effortlessly, which is essential to give the students a good grade in their studies.
2+ Reviews
10+ Question Solved
Related Book For 

Applied Statistics And Probability For Engineers
ISBN: 9781118539712
6th Edition
Authors: Douglas C. Montgomery, George C. Runger
Question Posted:
