

The following table shows the number of students who earned an A, B, C, and D grade
Question:
The following table shows the number of students who earned an A, B, C, and D grade in a business statistics class along with their year in their program.
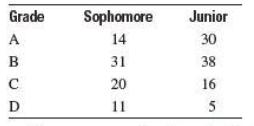
a. What percentage of students in this class are juniors?
b. What percentage of students in this class earned a B grade?
c. What percentage of students in this class were sophomores and earned a B grade?
d. What percentage of students in this class were juniors or earned an A grade?
e. What percentage of students in this class earned a C grade, given they were sophomores?
f. What percentage of students in this class were sophomores, given they earned a C grade?
g. Do course grade and year in the program appear to be independent or dependent? Define Event A as earning an A grade and Event B as a student in his or her sophomore year.
Step by Step Answer:
a b c d e f g P A 44165 0267 P A B P ...View the full answer


