

The weight and systolic blood pressure of 26 randomly selected males in the age group 25 to
Question:
TABLE 11-6 Water Data
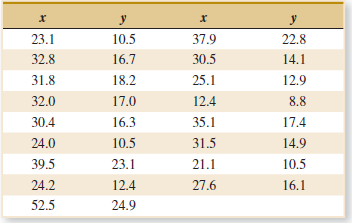
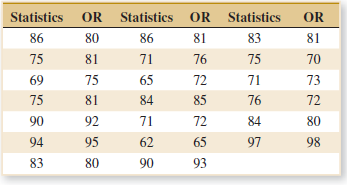
TABLE 11-7 Exam Grades
(a) Find a regression line relating systolic blood pressure to weight.
(b) Test for significance of regression using α = 0.05.
(c) Estimate the correlation coefficient.
(d) Test the hypothesis that Ï = 0, using α = 0.05.
(e) Test the hypothesis that Ï = 0, using α = 0.05.
(f) Construct a 95% confidence interval for the correlation coefficient.
Fantastic news! We've Found the answer you've been seeking!
Step by Step Answer:
a y 691044 0419415 x b Reject ...View the full answer

Answered By
Morgan Njeri
Very Versatile especially in expressing Ideas in writings.
Passionate on my technical knowledge delivery.
Able to multitask and able to perform under pressure by handling multiple challenges that require time sensitive solution.
Writting articles and video editing.
Revise written materials to meet personal standards and satisfy clients demand.
Help Online Students with their course work.
12+ Reviews
38+ Question Solved
Related Book For 

Applied Statistics And Probability For Engineers
ISBN: 9781118539712
6th Edition
Authors: Douglas C. Montgomery, George C. Runger
Question Posted:
