

Question: Refer to the NFL quarterback ratings data in Exercise 11-5. (a) Estimate the correlation coefficient between the ratings and the average yards per attempt. (b)
Refer to the NFL quarterback ratings data in Exercise 11-5.
(a) Estimate the correlation coefficient between the ratings and the average yards per attempt.
(b) Test the hypothesis H0: Ï = 0 versus H1: Ï ‰ 0 using α = 0.05. What is the P-value for this test?
(c) Construct a 95% confidence interval for Ï.
(d) Test the hypothesis H0: Ï = 0.7 versus H1: Ï ‰ 0.7 using α = 0.05. Find the P-value for this test.
Exercise 11-5
See Table E11-1 for data on the ratings of quarterbacks for the 2008 National Football League season (The Sports Network). It is suspected that the rating (y) is related to the average number of yards gained per pass attempt (x).
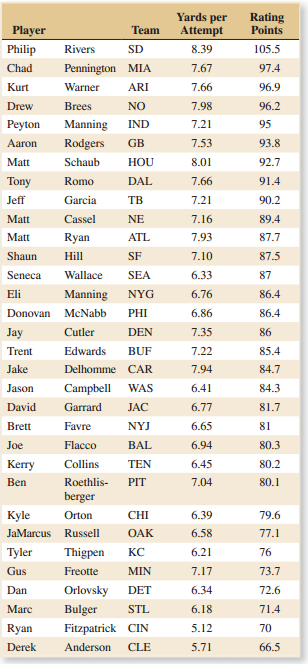
Yards per Attempt Rating Points Player Team Philip 105.5 Rivers SD 8.39 Chad Pennington MIA 7.67 97.4 Kurt Warner ARI 7.66 96.9 Drew Brees NO 7.98 96.2 IND Peyton Manning 7.21 95 Aaron Rodgers GB 7.53 93.8 Matt Schaub HOU 8.01 92.7 DAL Tony Romo 7.66 91.4 TB Jeff 7.21 Garcia 90.2 Matt Cassel NE 7.16 89.4 Matt Ryan ATL 7.93 87.7 Shaun Hill SF 7.10 87.5 Seneca Wallace SEA 6.33 87 NYG Eli Manning 6.76 86.4 6.86 Donovan MeNabb PHI 86.4 Jay Cutler DEN 7.35 86 Edwards 7.22 Trent BUF 85.4 Delhomme CAR Jake 7.94 84.7 Jason Campbell WAS 6.41 84.3 David Garrard JAC 6.77 81.7 Brett Favre NYJ 6.65 81 Joe Flacco BAL 6.94 80.3 Collins TEN Kerry 6.45 80.2 Ben Roethlis- PIT 7.04 80.1 berger Kyle CHI Orton 6.39 79.6 JaMarcus Russell OAK 6.58 77.1 Tyler 6.21 Thigpen KC 76 Gus Freotte MIN 7.17 73.7 Orlovsky Dan DET 6.34 72.6 6.18 Marc Bulger STL 71.4 Ryan Fitzpatrick CIN 5.12 70 Derek Anderson CLE 5.71 66.5
Step by Step Solution
3.28 Rating (166 Votes )
There are 3 Steps involved in it
Refer to the computer output ... View full answer

Get step-by-step solutions from verified subject matter experts