

Question: Using the data from Exercise 6-24 on swim times, (a) Find the median and quartiles for the data. (b) Make a box plot of the
(a) Find the median and quartiles for the data.
(b) Make a box plot of the data.
(c) Repeat (a) and (b) for the data without the extreme outlier and comment.
(d) Compare the distribution of the data with and without the extreme outlier.
Data from 6-24
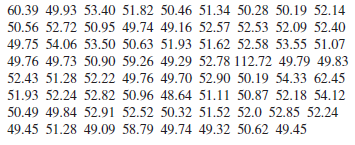
60.39 49.93 53.40 51.82 50.46 51.34 50.28 50.19 52.14 50.56 52.72 50.95 49.74 49.16 52.57 52.53 52.09 52.40 49.75 54.06 53.50 50.63 51.93 51.62 52.58 53.55 51.07 49.76 49.73 50.90 59.26 49.29 52.78 112.72 49.79 49.83 52.43 51.28 52.22 49.76 49.70 52.90 50.19 54.33 62.45 51.93 52.24 52.82 50.96 48.64 51.11 50.87 52.18 54.12 50.49 49.84 52.91 52.52 50.32 51.52 52.0 52.85 52.24 49.45 51.28 49.09 58.79 49.74 49.32 50.62 49.45
Step by Step Solution
3.47 Rating (163 Votes )
There are 3 Steps involved in it
a Descriptive Statistics Variable Mean SE Mean StDev Minimum Q1 Median Q... View full answer

Get step-by-step solutions from verified subject matter experts