

Question: For the sample size calculation described in Figure 16-4, explain the following statements: a. The required sample sizes are larger (all else held equal) the
For the sample size calculation described in Figure 16-4, explain the following statements:
a. The required sample sizes are larger (all else held equal) the lower the tolerable deviation rate (TDR).
b. The required sample sizes are larger the lower the acceptable risk of overreliance (ARO).
c. The required sample sizes are larger the higher the expected deviation rate.
d. The required sample sizes get larger when the difference between EDR and TDR increases (e.g., an EDR of 1 percent and TDR of 5 percent requires a sample size of 77 [10 percent ARO] whereas an EDR of 2 percent and TDR of 6 percent requires a sample of 88\()\). What does this imply for your estimate of EDR?
e. The finite correction factor lowers the necessary sample size.
Figure 16-4
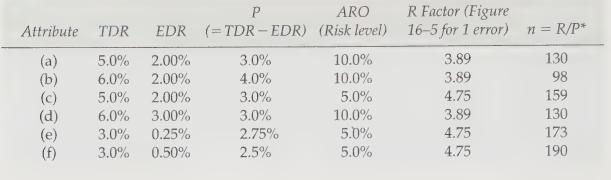
ARO R Factor (Figure Attribute TDR EDR (=TDR-EDR) (Risk level) 16-5 for 1 error) n = R/P* (a) 5.0% 2.00% 3.0% 10.0% 3.89 130 (b) 6.0% 2.00% 4.0% 10.0% 3.89 98 (c) 5.0% 2.00% 3.0% 5.0% 4.75 159 (d) 6.0% 3.00% 3.0% 10.0% 3.89 130 (e) 3.0% 0.25% 2.75% 5.0% 4.75 173 (f) 3.0% 0.50% 2.5% 5.0% 4.75 190
Step by Step Solution
There are 3 Steps involved in it

Get step-by-step solutions from verified subject matter experts