

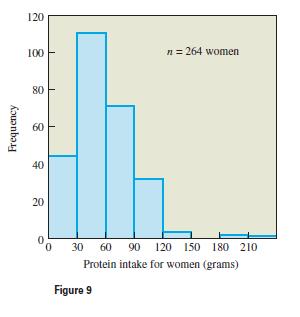
Figure 9 shows a histogram for a random sample of n = 264 women (drawn from the
Question:
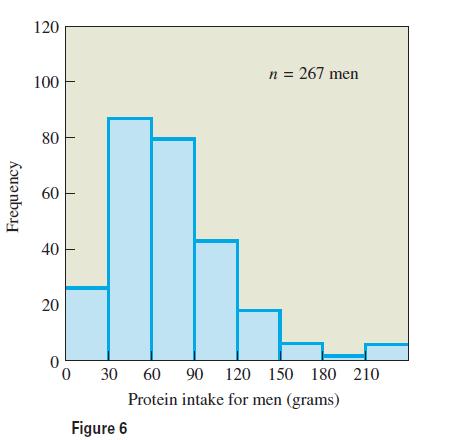
Figure 9 shows a histogram for a random sample of n = 264 women (drawn from the same NHANES III study used for the sample of men in Figure 6). The mean of these data is x = 59.6 grams and the standard deviation is s = 30.5 grams. Estimate the population mean and give a 95% confidence interval. Comment on how these values compare to the recommended daily allowance (RDA) for women of 45–50 grams.
Fantastic news! We've Found the answer you've been seeking!
Step by Step Answer:
We use the sample mean x 596 grams as our best and only estimate of the p...View the full answer

Answered By
Talha Talib
I am a member of IEEE society. As i am a student of electrical engineering badge 17 but beside of this i am also a tutor in unique academy. I teach calculus, communication skills, mechanics and economics. I am also a home tutor. My student Muhammad Salman Alvi is a brilliant A-level student and he performs very well in academics when i start to teach him. His weak point was mathematics but now he is performing well in mathematics. I am a scholarship holder in Fsc as i scored 1017 marks in metric out of 1100. Later on i got scholarship in Punjab Group of Colleges. I got 2nd position in robotics competition in 2018 as my project home automation select for the exhibition in Expocentre.
23+ Reviews
62+ Question Solved
Related Book For 
Statistical Reasoning For Everyday Life
ISBN: 9780321904645
4th International Edition
Authors: Jeffrey Bennett, William L. Briggs, Mario F. Triola
Question Posted:
