

Question: Make a stemplot for the data from Example 3. Discuss the pros and cons of the stemplot over a histogram. Data From Example 3:- The
Make a stemplot for the data from Example 3. Discuss the pros and cons of the stemplot over a histogram.
Data From Example 3:-
The following data show the ages (at the time when they won the award) of all Academy Award–winning actresses through 2012, sorted into age order. Display the data using 10-year bins. Discuss the results.
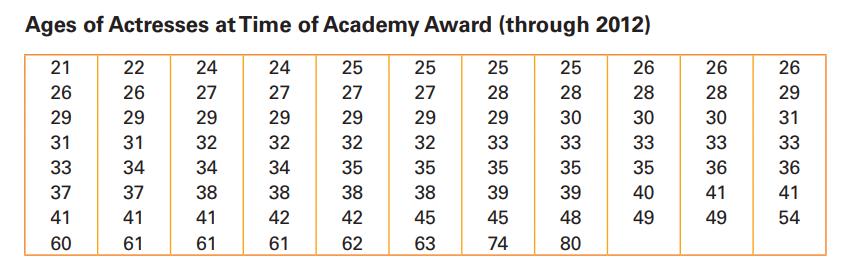
Ages of Actresses at Time of Academy Award (through 2012) 21 22 24 24 25 25 25 25 26 26 26 26 26 27 27 27 27 28 28 28 28 29 29 29 29 29 29 29 29 30 30 30 31 31 31 32 32 32 32 33 33 33 33 33 33 34 34 34 35 35 35 35 35 36 36 37 37 38 38 38 38 39 39 40 41 41 41 41 41 42 42 45 45 48 49 49 49 54 60 61 61 61 62 63 74 80
Step by Step Solution
3.39 Rating (152 Votes )
There are 3 Steps involved in it
The data are the ages of the actresses at time of award which range from 21 to 80 We therefore choos... View full answer

Get step-by-step solutions from verified subject matter experts