

The PA Seniors dataset has survey data from a sample of Pennsylvania high school seniors who participated
Question:
The PA Seniors dataset has survey data from a sample of Pennsylvania high school seniors who participated in the Census at Schools project over the decade from 2010 to 2019. One of the variables (TV Hours) asks about number of hours spent watching TV each week. To see how that variable might change over the decade we run a regression where the explanatory variable t measures time (in years) over the decade with t = 0 in 2010 and t = 9 in 2019. The fitted line predicting the average weekly hours of TV each year is
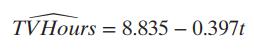
Based on the fitted line, about how much has the average weekly TV hours increased or decreased over this decade?
Step by Step Answer:
Based on the fitted line we can see that the slope of the regression line is n...View the full answer


Statistics Unlocking The Power Of Data
ISBN: 9781119682219
3rd Edition
Authors: Robin H Lock, Patti Frazer Lock, Kari Lock Morgan, Eric F Lock, Dennis F Lock
