

There are five variables in the dataset, and all are included in the scatterplot matrix shown in
Question:
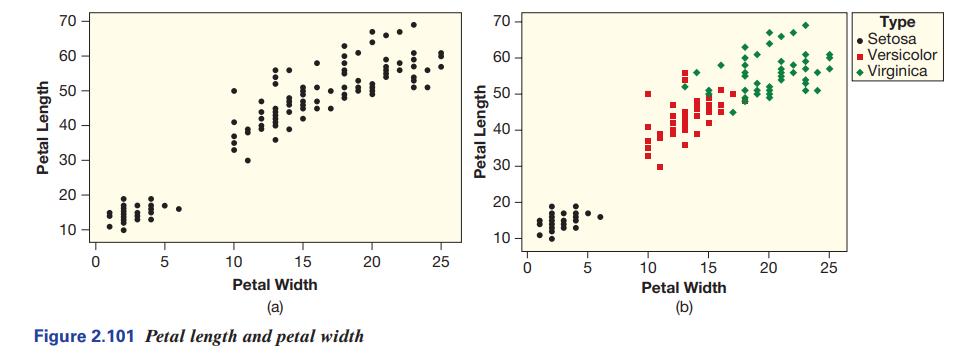
There are five variables in the dataset, and all are included in the scatterplot matrix shown in Figure 2.102. The graph shows scatterplots for each pair of quantitative variables, with the Type categorical variable included on each. For example, the second one down on the left is the same scatterplot as in Figure 2.101(b), with petal width on the horizontal axis and petal length on the vertical axis.
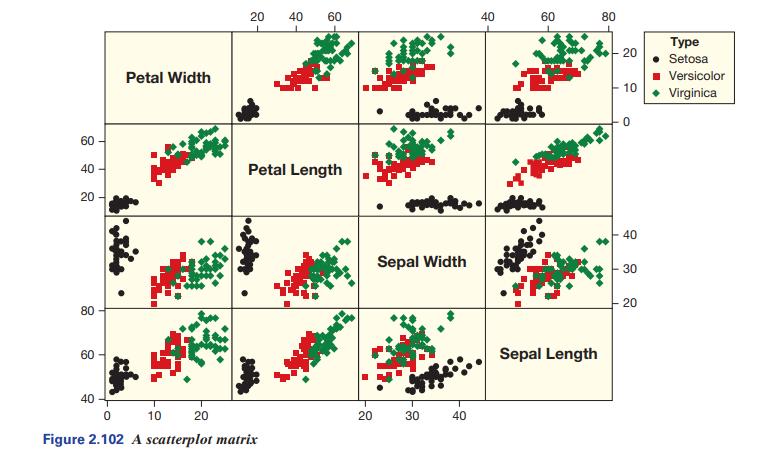
(a) Which shows a clearer distinction between Versicolor and Virginica: a scatterplot of petal length and petal width or a scatterplot of sepal length and sepal width?
(b) Considering only the Setosa type of iris, does the association between sepal width and petal length appear to be positive, negative, or neither?
Step by Step Answer:
a In a scatterplot showing an association between petal length an...View the full answer


Statistics Unlocking The Power Of Data
ISBN: 9781119682219
3rd Edition
Authors: Robin H Lock, Patti Frazer Lock, Kari Lock Morgan, Eric F Lock, Dennis F Lock
