

Question: Using the taste test data from Example 1, create a frequency table with columns for the relative and cumulative frequencies. What percentage of the respondents
Using the taste test data from Example 1, create a frequency table with columns for the relative and cumulative frequencies. What percentage of the respondents gave the cola the highest rating? What percentage gave the cola one of the three lowest ratings?
Data From Example 1:-
The Rocky Mountain Beverage Company wants feedback on its new product, Coral Cola, and sets up a taste test with 20 people. Each individual is asked to rate the taste of the cola on a 5-point scale:
![]()
The 20 ratings are as follows:
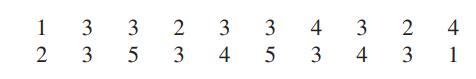
Construct a frequency table for these data.
(bad taste) 1 2 3 4 5 (excellent taste)
Step by Step Solution
3.37 Rating (147 Votes )
There are 3 Steps involved in it
We find the relative frequencies by dividing the frequency in each category by the total frequ... View full answer

Get step-by-step solutions from verified subject matter experts