

Question: Complete the following table for the given functions and then plot the resulting graphs. y = sin x X y X y +4 - 27.
Complete the following table for the given functions and then plot the resulting graphs.
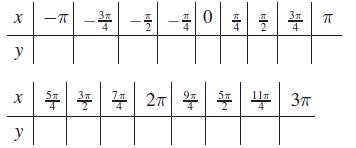
y = sin x
X y X y +4 - 27. 2 4 3
Step by Step Solution
★★★★★
3.44 Rating (170 Votes )
There are 3 Steps involved in it
1 Expert Approved Answer
Step: 1 Unlock

Below is an updated table for the values o... View full answer
Question Has Been Solved by an Expert!
Get step-by-step solutions from verified subject matter experts
Step: 2 Unlock
Step: 3 Unlock