

Question: Display the graph of r = 5 4 cos on a calculator, using (a) The polar curve mode, (b) The parametric curve mode. (See
Display the graph of r = 5 − 4 cosθ on a calculator, using
(a) The polar curve mode,
(b) The parametric curve mode. (See Example 6).
Data from Example 6
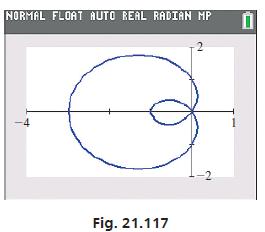
View the graph of r = 1 − 2cosθ on a calculator.
Using the mode feature, a polar curve is displayed using the polar graph option or the parametric graph option, depending on the calculator. (Review the manual for the calculator.) The graph displayed will be the same with either method.
With the polar graph option, the function is entered directly. The values for the viewing window are determined by settings for x, y and the angles θ that will be used. These values are set in a manner similar to those used for parametric equations. With the parametric graph option, to graph r = f(θ), we note that x = r cosθ and y = r sinθ . This tells us that
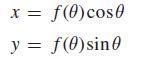
Thus, for r = 1 − 2cos, by using
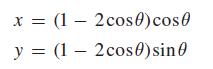
the graph can be displayed, as shown in Fig. 21.117.
x = f(0)cos0 y = f(0)sin0
Step by Step Solution
3.39 Rating (161 Votes )
There are 3 Steps involved in it
a To graph the polar curve r 5 4cos using the polar curve mode on a calculator follow these ste... View full answer

Get step-by-step solutions from verified subject matter experts