

Question: Find and interpret the values of r and r 2 for the given data. Exercise 13 Data from Exercises 13 In an experiment on the
Find and interpret the values of r and r2 for the given data.
Exercise 13
Data from Exercises 13
In an experiment on the photoelectric effect, the frequency of light being used was measured as well as the stopping potential (the voltage just sufficient to stop the photoelectric effect) with the results given below. Use a calculator to find the least-squares line for V as a function of f. The frequency for V = 0 is known as the threshold frequency. From the graph determine the threshold frequency.
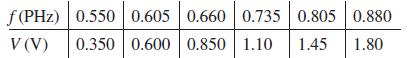
f(PHz) 0.550 0.605 0.660 0.735 0.805 0.880 0.350 0.600 0.850 1.10 1.45 1.80 V (V)
Step by Step Solution
3.35 Rating (158 Votes )
There are 3 Steps involved in it
To find the values of r and r2 we first need to find the correlation coefficient r Using a calc... View full answer

Get step-by-step solutions from verified subject matter experts