

Question: Find and interpret the values of r and r 2 for the given data. Exercise 10 Data from Exercises 10 In testing an air-conditioning system,
Find and interpret the values of r and r2 for the given data.
Exercise 10
Data from Exercises 10
In testing an air-conditioning system, the temperature T in a building was measured during the afternoon hours with the results shown in the table. Find the least-squares line for T as a function of the time t from noon. Then predict the temperature when t = 2.5. Is this interpolation or extrapolation?
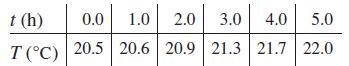
t (h) 0.0 1.0 2.0 3.0 4.0 5.0 T (C) 20.5 20.6 20.9 21.3 21.7 22.0
Step by Step Solution
3.29 Rating (149 Votes )
There are 3 Steps involved in it
ANSWER To find the leastsquares line for T as a function of t we need to calculate the slope and int... View full answer

Get step-by-step solutions from verified subject matter experts