

Question: Find the indicated regression model for the following data. Using aerial photography, the area A (in km 2 ) of an oil spill as a
Find the indicated regression model for the following data. Using aerial photography, the area A (in km2) of an oil spill as a function of the time t (in h) after the spill was found to be as follows:
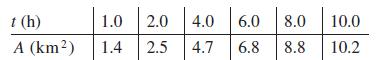
Compare the values of the coefficient of correlation r, to determine whether the linear equation or power equation seems to fit the data better.
t (h) A (km) 1.0 2.0 4.0 1.4 2.5 6.0 8.0 10.0 4.7 6.8 8.8 10.2
Step by Step Solution
3.41 Rating (148 Votes )
There are 3 Steps involved in it
From the scatter plot it appears that there is a nonlinear relationship between the variables Theref... View full answer

Get step-by-step solutions from verified subject matter experts