

Question: Find the indicated regression model for the following data. Using aerial photography, the area A (in km 2 ) of an oil spill as a
Find the indicated regression model for the following data. Using aerial photography, the area A (in km2) of an oil spill as a function of the time t (in h) after the spill was found to be as follows:
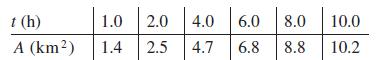
Find the linear equation y = ax + b to fit these data.
t (h) A (km) 1.0 2.0 4.0 1.4 2.5 6.0 8.0 10.0 4.7 6.8 8.8 10.2
Step by Step Solution
★★★★★
3.43 Rating (150 Votes )
There are 3 Steps involved in it
1 Expert Approved Answer
Step: 1 Unlock

To find the linear equation y ax b that fits the given data we need to perform linear regression on ... View full answer
Question Has Been Solved by an Expert!
Get step-by-step solutions from verified subject matter experts
Step: 2 Unlock
Step: 3 Unlock