

Question: In a random sample, 30 Android users were asked to record the number of apps that were installed on their phone. The resulting data are
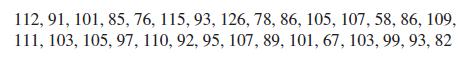
In a random sample, 30 Android users were asked to record the number of apps that were installed on their phone. The resulting data are shown below:
Make a frequency histogram using the table in Exercise 21. Describe the shape.
Data from Exercises 21
Make a frequency distribution table using the class limits 50, 60, 70, . . . , 130.
112, 91, 101, 85, 76, 115, 93, 126, 78, 86, 105, 107, 58, 86, 109, 111, 103, 105, 97, 110, 92, 95, 107, 89, 101, 67, 103, 99, 93, 82
Step by Step Solution
3.25 Rating (166 Votes )
There are 3 Steps involved in it
To make a frequency distribution table we first need to sort the data in ascendin... View full answer

Get step-by-step solutions from verified subject matter experts