

Question: In Example 2, change x + 3 to 3 x and then draw the graph of the resulting inequality. Data from Example 2 Draw
In Example 2, change x + 3 to 3 − x and then draw the graph of the resulting inequality.
Data from Example 2
Draw a sketch of the graph of the inequality y
Most calculators can be used to display the solution of an inequality involving two variables by shading a region above a curve, below a curve, or between curves. The manner in which this is done varies according to the model of the calculator. Therefore, the manual should be used to determine how this is done on any particular model of calculator. In Fig. 17.39, such a calculator display is shown for this inequality.
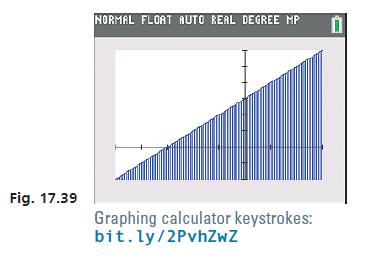
Fig. 17.39 NORMAL FLOAT AUTO REAL DEGREE MP Graphing calculator keystrokes: bit.ly/2PvhZwZ
Step by Step Solution
3.44 Rating (163 Votes )
There are 3 Steps involved in it
To change x 3 to 3 x we can subtract x from both sides and then add 3 to both sides giving us the ... View full answer

Get step-by-step solutions from verified subject matter experts