

Question: In Example 4, change x 2 4 to 4 x 2 and then draw the graph of the resulting inequality. Data from Example
In Example 4, change x2 − 4 to 4 − x2 and then draw the graph of the resulting inequality.
Data from Example 4
Although the graph of y = x2 − 4 is not a straight line, the method of solution is the same. We graph the function y = x2 − 4 as a dashed curve, since it is not part of the solution, as shown in Fig. 17.41. We then shade in the region above the curve to indicate the points that satisfy the inequality.
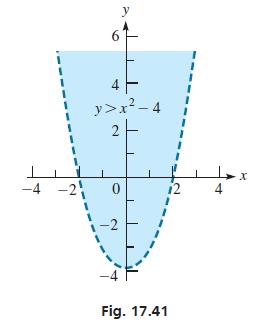
6 y 4 y>x - 4 -4-2 0 Fig. 17.41 I 12 4 X
Step by Step Solution
3.47 Rating (150 Votes )
There are 3 Steps involved in it
To graph the inequality 4 x2 0 we first need to find the critical values Setting 4 x2 equal ... View full answer

Get step-by-step solutions from verified subject matter experts