

Question: Plot graph of f(x) = 1 x+1 (for x < 0) (for x > 0)
Plot graph of
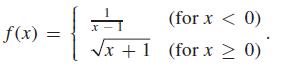
f(x) = 1 x+1 (for x < 0) (for x > 0)
Step by Step Solution
★★★★★
3.32 Rating (146 Votes )
There are 3 Steps involved in it
1 Expert Approved Answer
Step: 1 Unlock

To plot the graph of fx 1x1 for x 0 sqrtx1 for x 0 we can begin by identifying the critical points a... View full answer
Question Has Been Solved by an Expert!
Get step-by-step solutions from verified subject matter experts
Step: 2 Unlock
Step: 3 Unlock