

Question: Represent the data graphically The average exchange rate for the number of Canadian dollars equal to one U.S. dollar for 20142020 is as follows: Year
Represent the data graphically
The average exchange rate for the number of Canadian dollars equal to one U.S. dollar for 2014–2020 is as follows:
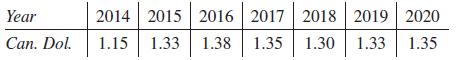
Year Can. Dol. 2014 2015 2016 2017 2018 2019 2020 1.15 1.33 1.38 1.35 1.30 1.33 1.35
Step by Step Solution
★★★★★
3.29 Rating (161 Votes )
There are 3 Steps involved in it
1 Expert Approved Answer
Step: 1 Unlock

To represent the data graphically we can use a line graph The horiz... View full answer
Question Has Been Solved by an Expert!
Get step-by-step solutions from verified subject matter experts
Step: 2 Unlock
Step: 3 Unlock