

Question: The intensity level B (in dB) and the frequency f (in Hz) for a sound of constant loudness were measured as shown in the table
The intensity level B (in dB) and the frequency f (in Hz) for a sound of constant loudness were measured as shown in the table that follows. Plot the data for B as a function of f on semilog paper, using the log scale for f.
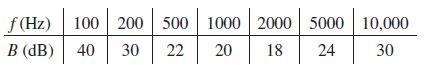
f(Hz) 100 200 200 B (dB) 40 30 500 500 1000 2000 5000 22 20 18 24 10,000 30
Step by Step Solution
★★★★★
3.41 Rating (160 Votes )
There are 3 Steps involved in it
1 Expert Approved Answer
Step: 1 Unlock

For the given data when plotted on a semilog paper we get a graph as be... View full answer
Question Has Been Solved by an Expert!
Get step-by-step solutions from verified subject matter experts
Step: 2 Unlock
Step: 3 Unlock