

Question: 10. A historic (circa 1920) data set on the relationship between car speed (X) and stopping distance (Y) is given in the R data frame
10. A historic (circa 1920) data set on the relationship between car speed (X) and stopping distance (Y) is given in the R data frame cars. Use the R output given below to answer the following questions
(a) What is the sample size in this study?
(b) Give the estimate of the standard deviation of the intrinsic error.
(c) Give the values of the T test statistics for testing H0 : α1 = 0 vs Ha : α1 ̸= 0 and H0 : β1 = 0 vs Ha : β1 ̸= 0. What are the corresponding p-values?
(d) Fill in the missing entries in the ANOVA table.
(e) What proportion of the total variability of the stopping distance is explained by the regression model?
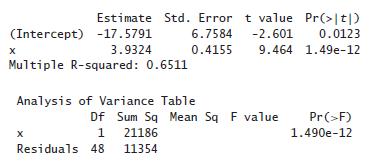
3.9324 Estimate Std. Error t value Pr(>|t|) (Intercept) -17.5791 x 6.7584 -2.601 0.0123 0.4155 9.464 1.49e-12 Multiple R-squared: 0.6511 Analysis of Variance Table Df Sum Sq Mean Sq F value x 1 Residuals 48 21186 11354 Pr(>F) 1.490e-12
Step by Step Solution
There are 3 Steps involved in it

Get step-by-step solutions from verified subject matter experts