

Question: 38. The following crosstabulation summarizes the data for two categorical variables, x and y. The variable x can take on values low, medium, or high
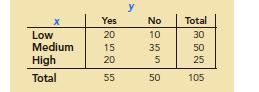
38. The following crosstabulation summarizes the data for two categorical variables, x and y. The variable x can take on values low, medium, or high and the variable y can take on values yes or no.
a. Compute the row percentages.
b. Construct a stacked percent frequency bar chart with x on the horizontal axis.
Applications
y Yes No Total Low 20 10 30 Medium 15 35 50 High 20 5 25 Total 55 50 50 105
Step by Step Solution
There are 3 Steps involved in it
1 Expert Approved Answer
Step: 1 Unlock

Question Has Been Solved by an Expert!
Get step-by-step solutions from verified subject matter experts
Step: 2 Unlock
Step: 3 Unlock