

Question: The following crosstabulation summarizes the data for two categorical variables x and y The variable x can take on values low medium or high and

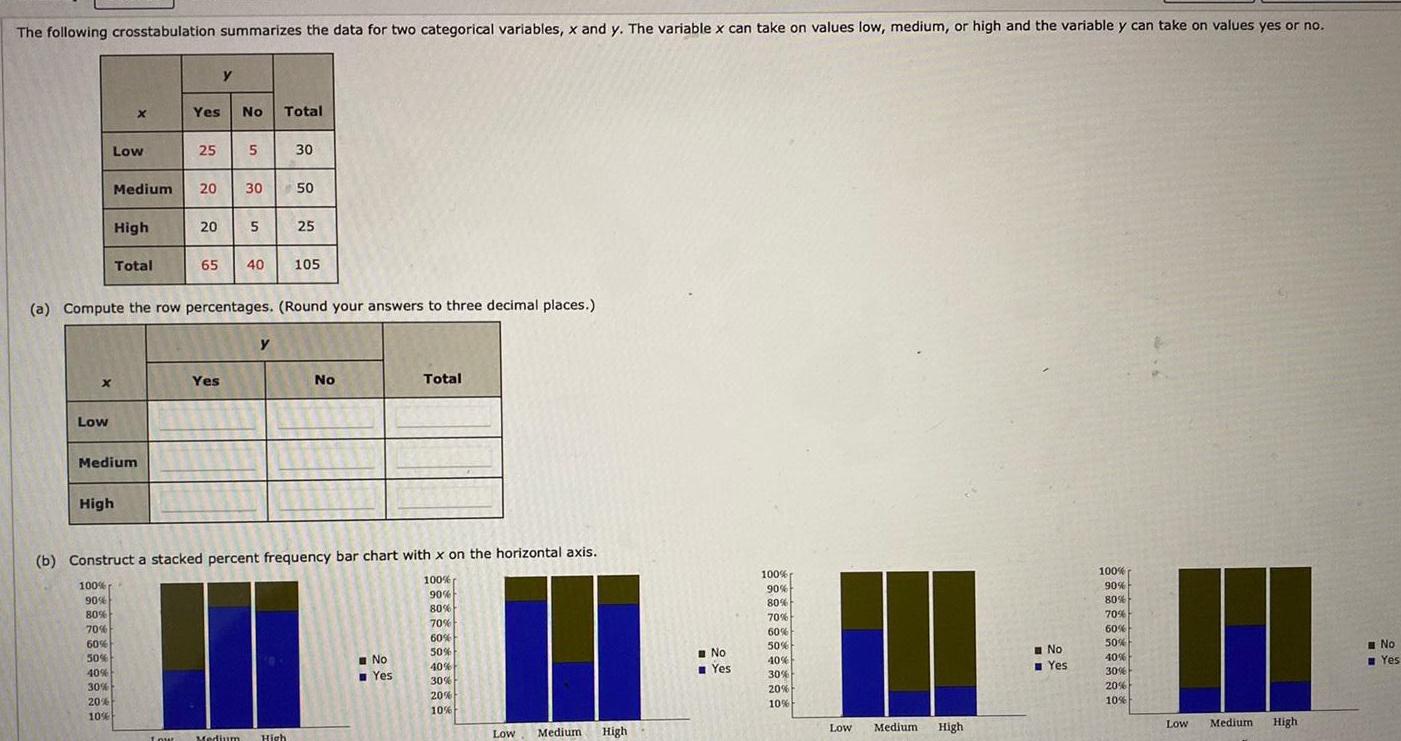
The following crosstabulation summarizes the data for two categorical variables x and y The variable x can take on values low medium or high and the variable y can take on values yes or no x Low Low High X 100 Medium 90 80 70 60 50 40 30 20 10 High Total Yes No Total 25 Medium 20 30 y 20 5 a Compute the row percentages Round your answers to three decimal places Yes 5 30 50 65 40 105 25 Lour Medium High b Construct a stacked percent frequency bar chart with x on the horizontal axis 100 90 80 70 60 50 No Total No Yes 40 30 20 10 LOW Medium High No Yes 100 90 80 70 60 50 40 30 20 10 Low Medium High No Yes 100 90 80 70 60 50 40 30 20 10 Low Medium High No Yes
Step by Step Solution
There are 3 Steps involved in it

Get step-by-step solutions from verified subject matter experts