In bioassays, the response may vary with a covariate termed the dose. A typical example involving a
Question:
In bioassays, the response may vary with a covariate termed the dose. A typical example involving a binary response is given in the following table, where R is the number of beetles killed after 5 hours of exposure to gaseous carbon disulphide at various concentrations (data from Bliss, 1935, quoted by Dobson, 2002, Example 7.3.1).
Example 7.3.1
A stopping rule s is said to be informative if its distribution depends on θ in such a way that it conveys information about θ in addition to that available from the values of x1 , x2 , ... ,Xs. The point of this section is to give a non-trivial example of an informative stopping rule; the example is due to Roberts (1967)
Consider a capture-recapture situation for a population of fish in a lake. The total number N of fish is unknown and is the parameter of interest (i.e. it is the θ of the problem). It is known that R of the fish have been captured tagged and released, and we shall write S for the number of untagged fish. Because S = N R and R is known, we can treat S as the unknown parameter instead of N, and it is convenient to do so. A random sample of n fish is then drawn (without replacement) from the lake. The sample yields r tagged fish and s = n - r untagged ones.
Assume that there is an unknown probability π of catching each fish independently of each other. Then the stopping rule is given by the binomial distribution as
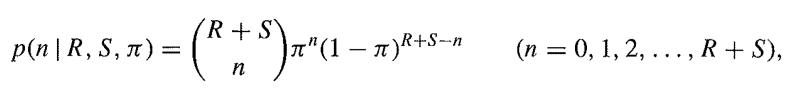
so that π is a nuisance parameter such that 0 ≤ π ≤ 1. Note that this stopping rule is informative, because it depends on N = R + S.
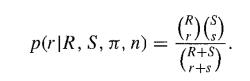
Conditional on R, N, π and n , the probability of catching r tagged fish out of n = r + s is given by the hypergeometric distribution
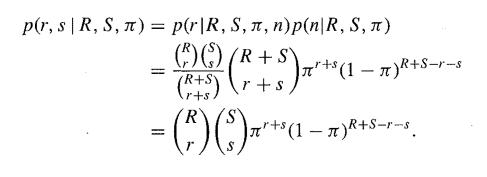
Because we know r and s if and only if we know r and n, it follows that
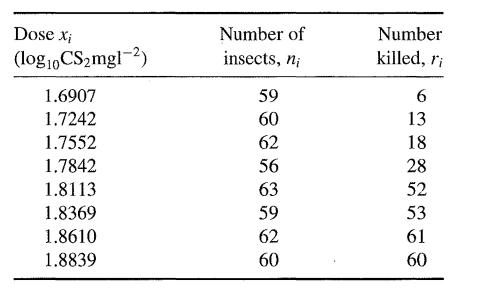
Fit a logistic regression model and plot the proportion killed against dose and the fitted line.
Step by Step Answer:
To approach this problem well first need to fit a logistic regression model to the provided data of beetles killed by varying concentrations of carbon ...View the full answer