

Question: In Example 3.9 (political involvement), compare predictive accuracy, DIC and LPML between the proportional odds logistic model and a model allowing the regression effect to
In Example 3.9 (political involvement), compare predictive accuracy, DIC and LPML between the proportional odds logistic model and a model allowing the regression effect to differ by response category,
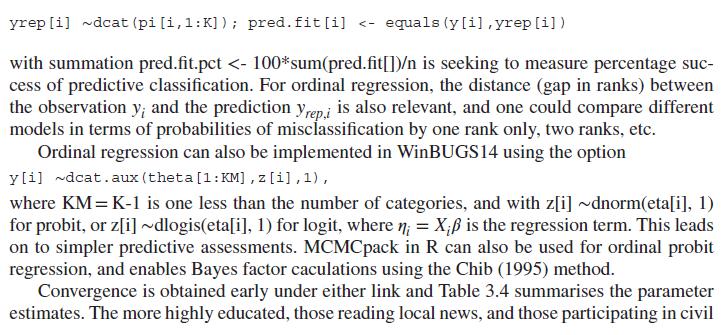
\[\gamma_{i j}=\operatorname{Pr}\left(y_{i} \leq j\right)=P\left(\theta_{j}-X_{i} \beta_{j}\right), \quad j=1, \ldots, K-1 .\]
Data from Example 3.9
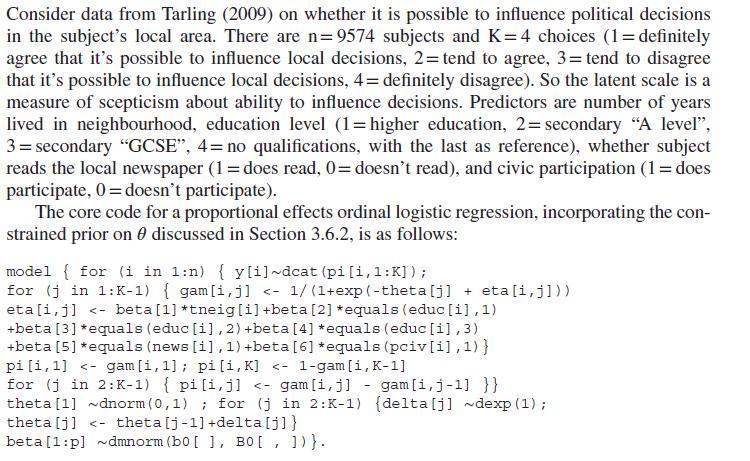
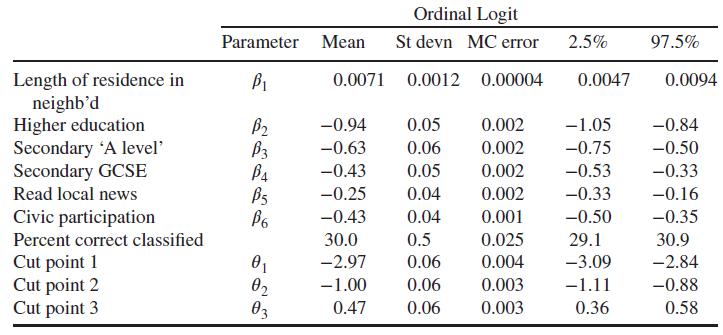
Consider data from Tarling (2009) on whether it is possible to influence political decisions in the subject's local area. There are n=9574 subjects and K=4 choices (1 = definitely agree that it's possible to influence local decisions, 2= tend to agree, 3= tend to disagree that it's possible to influence local decisions, 4= definitely disagree). So the latent scale is a measure of scepticism about ability to influence decisions. Predictors are number of years lived in neighbourhood, education level (1= higher education, 2= secondary "A level", 3= secondary "GCSE", 4= no qualifications, with the last as reference), whether subject reads the local newspaper (1 = does read, 0= doesn't read), and civic participation (1 = does participate, 0=doesn't participate). The core code for a proportional effects ordinal logistic regression, incorporating the con- strained prior on discussed in Section 3.6.2, is as follows: model { for (i in 1:n) { y[i] ~dcat (pi [i, 1:K]); for (j in 1:K-1) { gam[i, j]
Step by Step Solution
3.58 Rating (159 Votes )
There are 3 Steps involved in it

Get step-by-step solutions from verified subject matter experts