

Question: In Example 4.7 (motorcycle data) use a one-dimensional thin plate spline function with random coefficients to model the non-linear effect. Use the mixed replicate predictive
In Example 4.7 (motorcycle data) use a one-dimensional thin plate spline function with random coefficients to model the non-linear effect. Use the mixed replicate predictive scheme to assess the proportion of poorly fitted cases (e.g. posterior predictive probabilities that \(y_{i}\) exceeds \(y_{\text {rep }, i}\) that are under 0.05 or over 0.95 ). Assess improvements to predictive fit through
(a) replacing the constant varance assumption for \(\varepsilon_{t}\) by a scale mixture of normals (equivalent to Student \(t\) ) with unknown degrees of freedom, and
(b) modelling the error variances \(h_{t}=\log \left(\sigma_{t}^{2}\right)\) in relation to \(x_{t}\), also using a thin plate spline.
Data from Example 4.7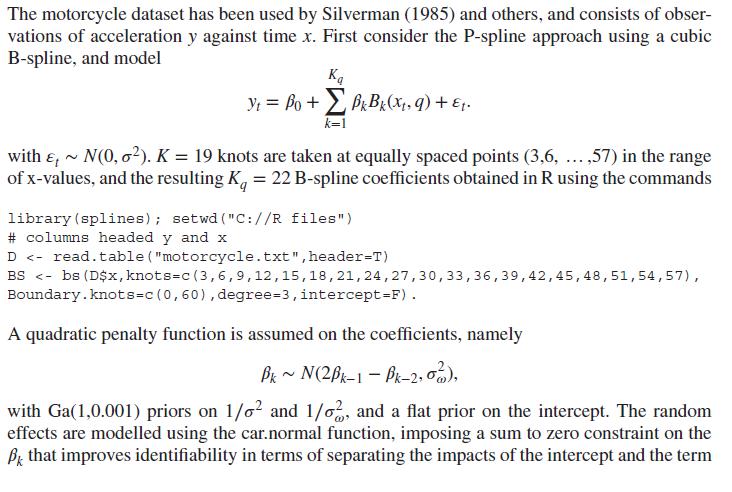
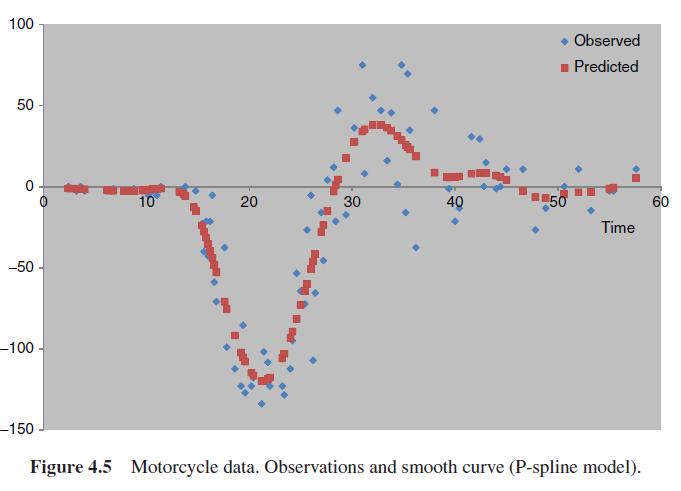
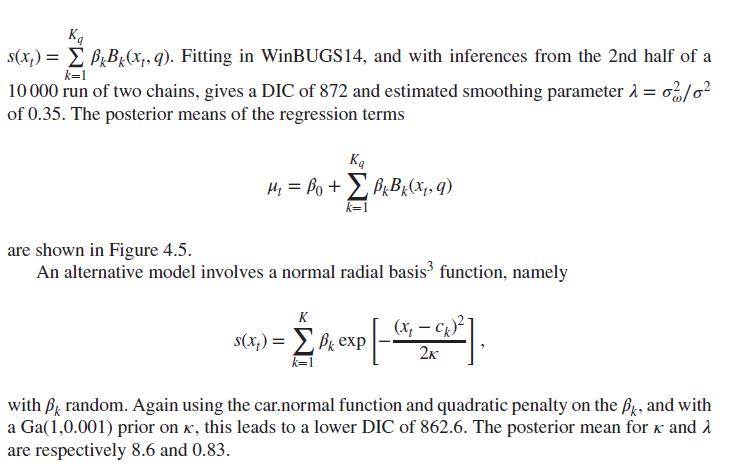
The motorcycle dataset has been used by Silverman (1985) and others, and consists of obser- vations of acceleration y against time x. First consider the P-spline approach using a cubic B-spline, and model y = Po + Bk Bk (xt, q) + . k=1 with &, ~N(0,02). K = 19 knots are taken at equally spaced points (3,6,...,57) in the range of x-values, and the resulting K = 22 B-spline coefficients obtained in R using the commands library (splines); setwd ("C://R files") # columns headed y and x D
Step by Step Solution
3.52 Rating (166 Votes )
There are 3 Steps involved in it

Get step-by-step solutions from verified subject matter experts