Question: 1. What are the analysis methods mentioned in the case? (relevant to statistical engineering and read six sigma). 2. What are the advantages of each
1. What are the analysis methods mentioned in the case? (relevant to statistical engineering and read six sigma).
2. What are the advantages of each method mentioned? and What is the one they used?
3. Discuss and write down about the characteristics, advantages and disadvantages of carrying out the "transformation" of variables such as the one mentioned on the penultimate page of the case. You can use additional resources on the internet / library to support your answer.
4. What are the KPIV and KPOV? Are KPIVs different for each KPOV?
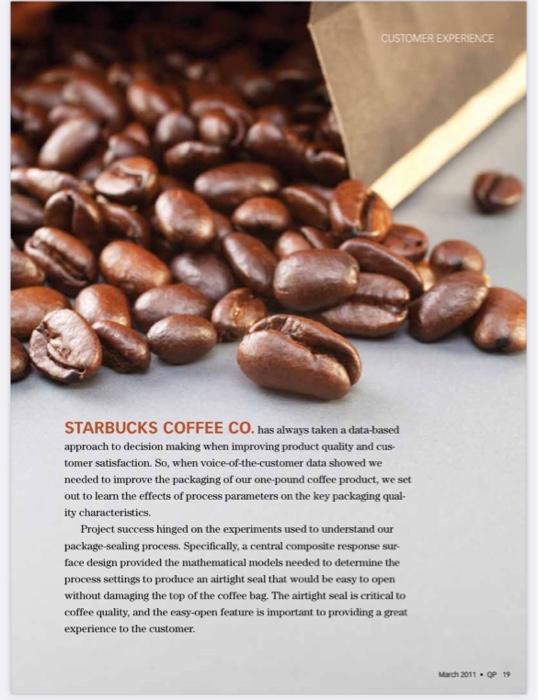
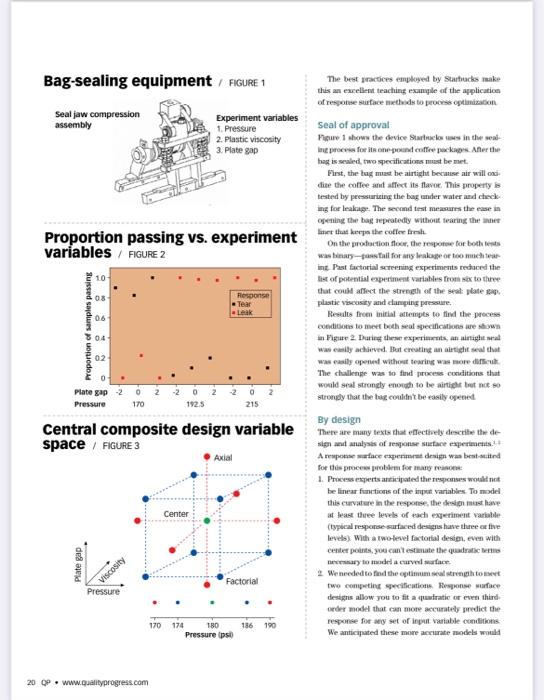
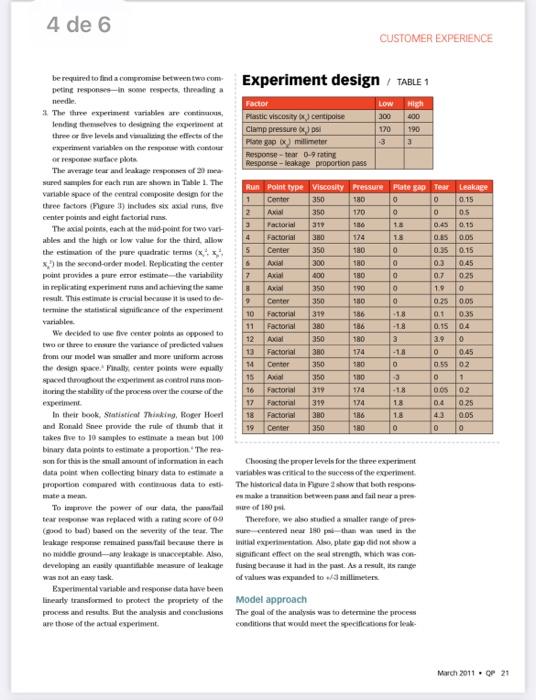
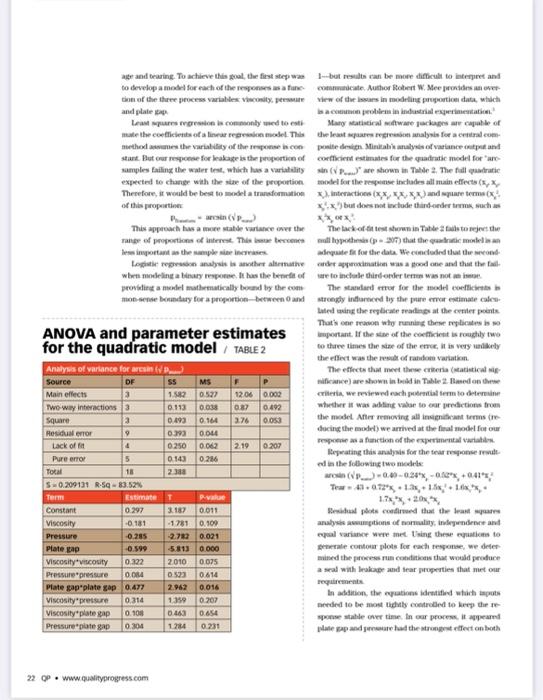
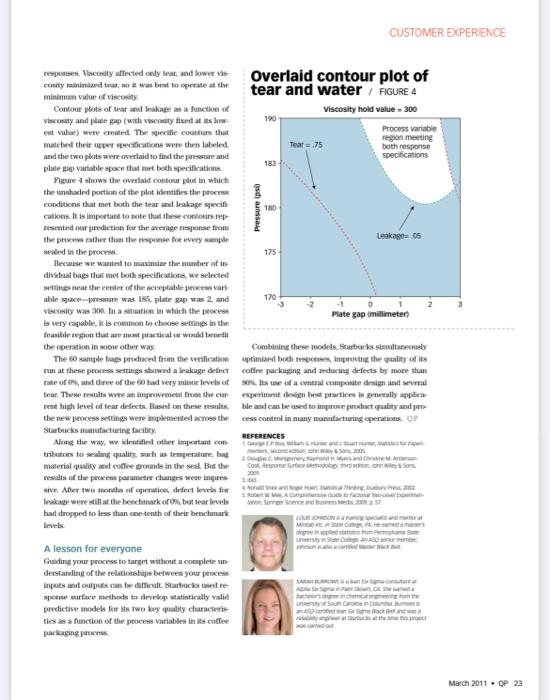
1 de 6 For Starbucks, It's in the Bag How the java giant fine-tuned its sealing process and improved product quality by Louis Johnson and Sarah Burrows In 50 Words Or Less When voice-of-the customer feedback revealed issues with Starbucks packag ing the company set Out on a data-driven journey to remedy the problems Using mathematical models to analyze its package tealing process the company found a solution to keep its coffee fresh and customers happy CUSTOMER EXPERIENCE STARBUCKS COFFEE CO. has always taken a data-based approach to decision making when improving product quality and eus tomer satisfaction. So, when voice-of-the-customer data showed we needed to improve the packaging of our one-pound coffee product, we set out to learn the effects of process parameters on the key packaging qual- ity characteristics Project success hinged on the experiments used to understand our package-sealing process. Specifically, a central composite response sur face design provided the mathematical models needed to determine the process settings to produce an airtight seal that would be easy to open without damaging the top of the coffee bag. The airtight seal is critical to coffee quality, and the easy-open feature is important to providing a great experience to the customer. March 2011 OP 19 Bag-sealing equipment FIGURE 1 Seal jaw compression assembly Experiment variables 1. Pressure 2. Plastic viscosity 3. Plate gap Proportion passing vs. experiment variables / FIGURE 2 The best practices employed by Starbucks make this an excellent teaching example of the application of response surface methods to process optimization Seal of approval Page 1 shows the device Starbucks in the wat In process for its on pound coffee packapes. After the tragis sealed, two specifications must be met First, the bag masthe airtight be mise air willo dize the coffee and affect its flavor. This property is tested by pressurizing the bag under water and check ing for leakage. The second test measures the ease in opening the bag repeatedly without tearing the one limet that keeps the coffee On the protection for the response for both tests was narystalt for any age or too much ing Past factorial screening experiments reduced the list of potential experiment variables from six to three that could affect the strength of the seal plates plastie viscosity and camping pressure Hells from initial attempts to find the process conditions to meet both seal specifications are shown in Figure 2. During these experiments, an right wall was cally achieved. But creating an altight seal that was easily opened without tearing was more difficult The challenge was to find process conditions that would seal strongly enough to be airtight but not so strongly that the top couldn't be easily opened 10 08 Response Tear - Lek Proportion of samples passing 04 2 -2 2 Plate gap 2 Pressure 0 170 0 1925 -20 215 Central composite design variable space/ FIGURE 3 Axial Center By design There are many texts that effectively describe the de sign and analysis of response surface experiments A repose face experiment design was best suited for proces prom for man 1. Processo perts anticipated the responses would not be linear functions of the input variables. To model this curvature in the response, the designs have at least three levels of each experiment variable (typical response suced designs have three stive levels)With a two-level factorial design, even with center pointyou can't estimate the quadratic necessary to moda de We needed to find the optimal song two competing specifications Response wurface designs allow you to fit a quadratic or even third Order model that can more accurately predict the response for my set of input variable conditions We anticipated these more accurate models would Plate gap Viscosity Factorial Pressure 136 190 170 174 180 Pressure ipsi 20 OP. www.Qualityprogress.com 4 de 6 CUSTOMER EXPERIENCE lo 4 6 BIBI 7 0 8 0 0 9 0.35 Axdal 3 3.9 be required to find a compromise between two com Experiment design / TABLE 1 peting responses-- In some respects threading a needle Factor High The three experiment variables are con Plastic viscosity certipoise 200 400 Sending themselves to designing the experimentat Clamp pressures 170 190 three or the levels and imalising the effects of the experiment variable on the report with conto Pane gpx) millimeter -3 3 Ore face plots Response - tear 0-9 rating The werage tear and Seakage repose of me Response - leakage proportion pass sured samples for each an are shown in Table 1. The variable space of the central composite design for the Run Point type Viscosity Pressure Plate sap Tear Leakage 1 Center 350 180 0 0 0.15 three factors (Figure 3) includes six axial runs, five 2 center points and eight factorial nas. Axial 350 170 0 OS 3 The acial points, each at the mid-point for two var Factorial 311 186 18 0.45 0.15 ables and the high or low value for the third, allow Factorial 30 124 0.85 0.05 the estimation of the pure quadratic terms (x 5 Center 350 180 0 0.15 x in the red-order model. Replicating the center Axial 300 180 0.45 point provides a pure error estimate the variability Axial 400 180 0.7 025 in replicating experiment nuts and achieving the same Axial 350 190 1.9 result. This estimate is crucial bereit is used to de Center 350 180 0.25 0.05 termine the statistical significance of the experiment 10 Factoria 319 186 -18 0.1 variables 11 Factorial 380 186 +18 0.15 We decided to wwe five center points as opposed to 0.4 12 350 180 0 two three to the variance of predicted values 13 from our model win sales and more informace Factorial 380 174 -18 0.45 14 the design e al points were equally Center 350 180 0.55 02 Spaced thout the experiments control as moon- 15 Axial 350 180 itoring the stability of the processorer the course of the 16 Factorial 319 974 -18 02 experime 17 Factorial 319 174 18 0.4 0.25 In their book, Statistical Thinking, Roger Hoel 18 Factorial 380 186 18 43 0.05 and Ronald Snee provide the rule of them that it 19 Center 350 180 takes five to 10 samples to estimate mean but 100 binary data points to estimate a proportion. There son for this is the small amount of information in each Choosing the proper levels for the three experiment data point when collecting binary data to estimate a variables was critical to the success of the experiment proportion compared with comimos data to est. The historical data in pure show that both respons matea mea. es make a transition between passend faileare To improve the power of our data, the pill of 180 pol. tear response was replaced with a rating score of Therefore, we also studied a smaller range of pres (good to bad) based on the severity of the tear. The sure centered near 10-thun was used in the leakage response remained pass/fail because there is al experimentation. Also, plate up did not showa to middle pround-any leakage is unacceptable. Also, sificant effect on the seal strength, which was con developing an essly quantifiable measure of leakage using because it had in the past. As a result, its range was not an easy task. of values was expanded to millimeters Experimental variable and response data have been linearly transformed to protect the propriety of the Model approach process and results. But the analysis and conclusions The goal of the analysis was to determine the process are those of the actual experiment conditions that would meet the recitations for brak 0 3 1 0 0 March 2011. OP 21 aper and bearing. To achieve this goal, the first step w 1-but resulteran be more difficult to interpretand to develop a model for each of the prese concate Author Robert W. Mee pedesano tion of the three process variables Viscomity, peste view of the sain modeling proportion date, which and plate aces in industriale Leatures son is commonly wed to esti Many tattical tware packages ar capable of mate the coefficients of a linear regression model. This the last canalysis for a cal.com methods the variability of these composite design Miniatures of variance up and start. But our response for leakage is the proportion of coefficient estimates for the quadratic model forare samples failing the water test, which lus a variability in ( are shown in Table 2. The filtratie expected to change with the size of the proportion model for the response includes all main effects (s, Therefore, it would be best to modela transformation Interaction (x) and water of this propter Xix"but does not include thindonderrms, such as Ph.) This approach us a metade race the The tek of its shown in Table to reject the of proportion of interest. The best poss307) that the articles an e portant as the samples eft for the date Wedded that the end Logistieron analysis is the armative derisa od one and that the all when modeling abiary repone. It has the benefit of to include third onder een was not providing a model mathematically bound by the com The standardmor for the model coefficient mon sense boundary for a proportion between 0 and strongly informed by the pure error estimate cales Inted wing the replicate reading at the center points That's one reason why running these replicates is ANOVA and parameter estimates mportant. If the stue of the coefficient is roughly two for the quadratic model TABLE 2 to three times the use of the re, it is very diety the effect was the result of random vartation Analysis of variance for resin The effects that meet these criteria (statistical Source DF ss MS nificance) are shown in bed in Table 2. med on the Main effects 3 1.582 0.527 12.06 0.002 cent, we wachten to determine Two way Interactions 3 0.113 0.038 03 0.492 whether it was adding aan toor predictions from Square 3 0.193 0.144 3.76 O.O the model Anemoving all instant terms Residual or 9 0.39 0.04 cacing the model) we arrived at the final model for our Lack of a 0250 0.062 2.19 0.207 pation of the experimental variable Pure error Begrating this analysis for the terresponse wat 5 0.143 0.286 ed in the following two modele Total 2388 (-0.40.020,00, +041" 50.209131 R SQ-83.52% Term Estimate T P value 17.20 Constant 0.297 3.187 0.011 Septed that the bal Viscosity -0.181 - 1781 0.100 analysis mitions of morality Indendence and Pressure 0.285 2.732 0.021 pul variance were meting these to 0.599 5.813 0 000 peale contour plots for each response, we deler Viscosityviscosity 0.322 2010 0.075 mined the process in conditions that would produce Pressure pressure 0.0154 0593 0.614 a seal with brace and tear properties that metu Plate gap plate gap 0.477 requirements 2.962 0.016 In addition, the caption identified which puts Viscosity pressure 0.314 1350 0.207 needed to be most controlled to keep there Viscosity plate gap 0.108 0.463 0.654 sponse talle over time. In our process, it appeared Pressure plate gap 0.30 1.24 0.231 plate map and read the strongest effect on both F P Plate gap 22 OP. www.qualityprogress.com CUSTOMER EXPERIENCE 183 Pressures responses Viscosity affected only eat and lower Vis Overlaid contour plot of cosity minimesed tu, no # was best to operate at the tear and water / FIGURE 4 minimum value of viscosity Contour plots of tear and leakage as a function of Viscosity hold Value - 300 Viscosity and place up (with viscosity fixed at its low 190 est value) were created. The specific counters that Process variable region meeting matched their per specifications were then labeled Tear = .75 both response and the two plots were overlaid to find the pressure and Specifications plate pp variable space that met both specifications pure shows the overald contour plot in which the shaded portion of the plot identifies the process conditions that met both the tear and breakage specif 180 cations. It is important to note that these coup resented our prediction for the average response from the process rather than the response for every Leakage-05 sealed in the proc. 175 Because we wanted to maximize the number of in dividual bags that met both specifications, we selected wetting near the center of the acceptatie process able space-pressure was 155, plate gap was 2. and 170 viscosity was 300 in a situation in which the process Plate gap (millimeter is very capable. It is common to choose settings in the frasible region that are meant practical car would be the operation in some other way Combining these model, Starbucks strony The 60 sample es produced from the verification optimized both responses, improving the quality of its run at these process settings showed a leakage defect coffee packaging and reducing defects by more than rate or $, and three of the chad very minue levels of its use of a central composite design and several tear. These results were an improvement from the current in best practices is really appli rent high level of tear defects. Based on these results. bleandem be used to improve product quality and pro the new process settings were implemented across the cess control in many unfacturing operations op Staebucks manufacturing facility REFERENCES Along the way, we entified other important con , tributors to sealing quality, such as temperature, bas 2. material quality coffee grounds in the seal. But the Cook Response to this som 2006 results of the process parameter clunges were impres wive. After two months of operation defect levels for W camper leakage were still at the benchmark of butter levels had dropped to less than che tenth of their benchmark LO levels. MORES Cegere medar keine niestety A lesson for everyone Guiding your process to target without a complete un derstanding of the relationships between your process inputs and outputs can be difficult Starbucksedre efetto develop statistically valid Chrome predictive models for its two key quality characters Com Ocean ties as a function of the process variables in its coffee . packaging proces March 2011 OP 23