

Question: In Example 7.2 include a posterior predictive check (e.g. using the Jarque-Bera criterion) of the normality of the permanent effects (left(b_{i} ight)) in model 2.
In Example 7.2 include a posterior predictive check (e.g. using the Jarque-Bera criterion) of the normality of the permanent effects \(\left(b_{i}\right)\) in model 2.
Data from Example 7.2
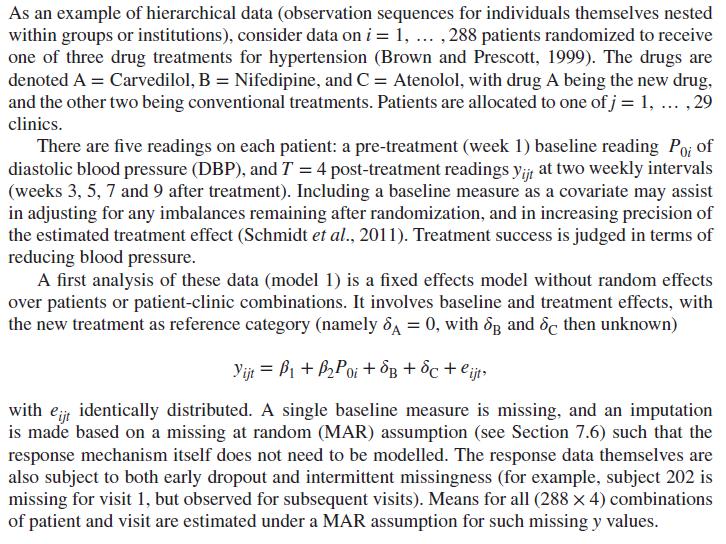
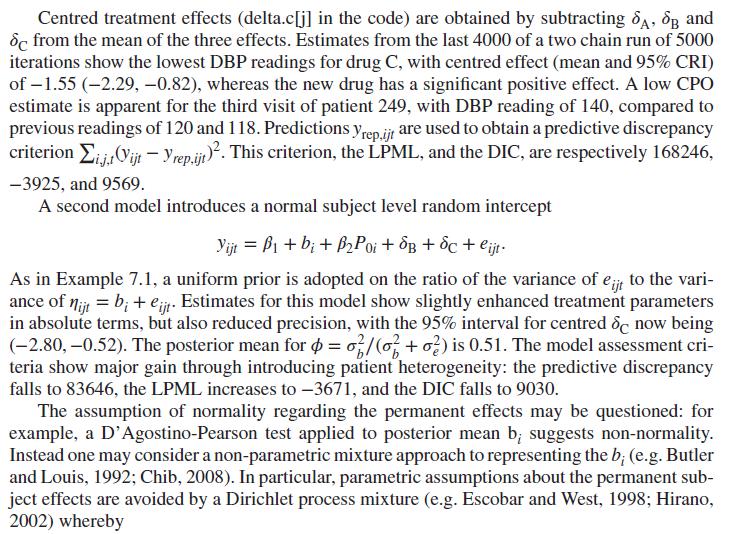
As an example of hierarchical data (observation sequences for individuals themselves nested within groups or institutions), consider data on i = 1, ..., 288 patients randomized to receive one of three drug treatments for hypertension (Brown and Prescott, 1999). The drugs are denoted A = Carvedilol, B = Nifedipine, and C = Atenolol, with drug A being the new drug, and the other two being conventional treatments. Patients are allocated to one of j = 1, ..., 29 clinics. There are five readings on each patient: a pre-treatment (week 1) baseline reading Po; of diastolic blood pressure (DBP), and 7 = 4 post-treatment readings yijt at two weekly intervals (weeks 3, 5, 7 and 9 after treatment). Including a baseline measure as a covariate may assist in adjusting for any imbalances remaining after randomization, and in increasing precision of the estimated treatment effect (Schmidt et al., 2011). Treatment success is judged in terms of reducing blood pressure. A first analysis of these data (model 1) is a fixed effects model without random effects over patients or patient-clinic combinations. It involves baseline and treatment effects, with the new treatment as reference category (namely = 0, with B and 8c then unknown) Yijt = B1+ B2Poi + B + C + e ijt with eijt identically distributed. A single baseline measure is missing, and an imputation is made based on a missing at random (MAR) assumption (see Section 7.6) such that the response mechanism itself does not need to be modelled. The response data themselves are also subject to both early dropout and intermittent missingness (for example, subject 202 is missing for visit 1, but observed for subsequent visits). Means for all (288 x 4) combinations of patient and visit are estimated under a MAR assumption for such missing y values.
Step by Step Solution
3.39 Rating (165 Votes )
There are 3 Steps involved in it

Get step-by-step solutions from verified subject matter experts