

Question: Given below are data on real GDP and potential GDP for the United States for the years 20002013, in billions of 2009 dollars. For each
Given below are data on real GDP and potential GDP for the United States for the years 2000–2013, in billions of 2009 dollars. For each year, calculate the output gap as a percentage of potential GDP and state whether the gap is a recessionary gap or an expansionary gap. Also calculate the year-to-year growth rates of real GDP.
Identify the recessions that occurred during this period? (LO2)
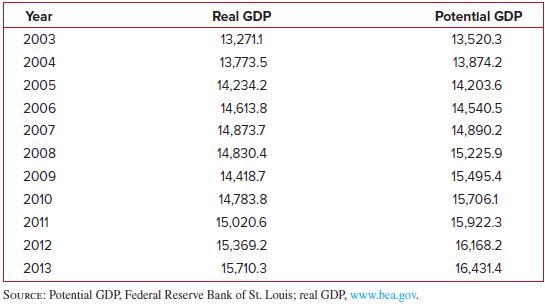
Year Real GDP Potential GDP 2003 13,271.1 13,520.3 2004 13,773.5 13,874.2 2005 14,234.2 14,203.6 2006 14,613.8 14,540.5 2007 14,873.7 14,890.2 2008 14,830.4 15,225.9 2009 14,418.7 15,495.4 2010 14,783.8 15,706.1 2011 15,020.6 15,922.3 2012 15,369.2 16,168.2 2013 15,710.3 16,431.4 SOURCE: Potential GDP, Federal Reserve Bank of St. Louis; real GDP, www.bea.gov.
Step by Step Solution
There are 3 Steps involved in it

Get step-by-step solutions from verified subject matter experts